KOVVADA NUCLEAR REACTOR (10,000 MW) EXPLOSION SCENARIO AND DISASTER MANAGEMENT
Prof.T.Shivaji Rao, Director, Center Environmental Studies, GITAM University, Visakhapatnam
http://www-pub.iaea.org/MTCD/publications/PDF/INES-2009_web.pdf- (Working Model for Event category)
http://www.nirs.org/reactorwatch/licensedtokill/LiscencedtoKill.pdf
(MoEF gives Terms of Reference for EIA preparation for Nuclear Plants pages-5and 59)
http://www.nirs.org/factsheets/naturaldisaster&nuclearpower.pdf [Hurricane impact on Reactor]
http://www.nirs.org/factsheets/bestofnuclearboondoggles052005.pdf {Reactors Cancelled,USA]
http://www.reachingcriticalwill.org/resources/publications/costs-risks-myths/report.pdf
][see pages:26,33,43,65 and other pages to realise that Reactors are risky and costly]
Nuclear accidents inevitable in almost all countries as can be seen from the following website
http://en.wikipedia.org/wiki/Nuclear_power_accidents_by_country
http://peswiki.com/index.php/Directory:Cents_Per_Kilowatt-Hour [Nuclear is costlier to coal,,Gas]
www.ceeraindia.org/documents/gsr347.doc {EAP Rules]
http://www.fas.org/sgp/crs/misc/RL33558.pdf [Latest US.policy on Nuclear plants]
http://www.osti.gov/bridge/servlets/purl/102183-vTsUij/webviewable/102183.pdf [Accidengt modelling]
Click on :Download the Excel model. (software used for calculations of accident scenario)
http://saarc-sdmc.nic.in/pdf/india/file4.pdf (Govt.of India NIDM report on disaster management)
http://saarc-sdmc.nic.in/pdf/india/file5.pdf (Risk Management,NIDM GOI)
http://saarc-sdmc.nic.in/pdf/india/file6.pdf (Disaster Management,NIDM,GOI)
http://saarc-sdmc.nic.in/pdf/india/file2.pdf (Disaster Management, Advise to states,NIDM,GOI)
http://cwc.gov.in/main/downloads/EAPChapters.pdf (EAP report for dam burst scenario,GOI)
http://www-pub.iaea.org/MTCD/publications/PDF/INES-2009_web.pdf- (Working Model for Event category)
http://www.nirs.org/reactorwatch/licensedtokill/LiscencedtoKill.pdf
(Killing fishes and marine life due to reactor effluents,
cheating by nuclear industry pages 101 and 104)
http://www.indiawaterportal.org/sites/indiawaterportal.org/files/EIA_guidelines_nuclear_power_plants_2010.pdf(MoEF gives Terms of Reference for EIA preparation for Nuclear Plants pages-5and 59)
(Radiation and cell breakage)
(Basic radiation impacts)
http://www.nrc.gov/reading-rm/doc-collections/nuregs/staff/sr1437/supplement34/vegp-fseis-34.pdf (a model EIA report submitted in USA for granting licence to Vogtle Nuclear Reactors in Georgia)(Basic radiation impacts)
http://www.nirs.org/factsheets/naturaldisaster&nuclearpower.pdf [Hurricane impact on Reactor]
http://www.nirs.org/factsheets/bestofnuclearboondoggles052005.pdf {Reactors Cancelled,USA]
http://www.reachingcriticalwill.org/resources/publications/costs-risks-myths/report.pdf
][see pages:26,33,43,65 and other pages to realise that Reactors are risky and costly]
Nuclear accidents inevitable in almost all countries as can be seen from the following website
http://en.wikipedia.org/wiki/Nuclear_power_accidents_by_country
http://peswiki.com/index.php/Directory:Cents_Per_Kilowatt-Hour [Nuclear is costlier to coal,,Gas]
www.ceeraindia.org/documents/gsr347.doc {EAP Rules]
http://www.fas.org/sgp/crs/misc/RL33558.pdf [Latest US.policy on Nuclear plants]
http://www.osti.gov/bridge/servlets/purl/102183-vTsUij/webviewable/102183.pdf [Accidengt modelling]
http://www.davistownmuseum.org/cbm/index.html (Most fundamental data on Nuclear plants)
http://www.nrc.gov/reading-rm/doc-collections/nuregs/staff/sr1887/sr1887.pdf (Source terms,USA)
http://en.wikipedia.org/wiki/AP1000 [kovvada plant]
http://www.nrc.gov/reading-rm/doc-collections/nuregs/staff/sr1887/sr1887.pdf (Source terms,USA)
http://en.wikipedia.org/wiki/AP1000 [kovvada plant]
Fukushima accident shows that Visakhapatnam must be evacuated for Twenty years due to reactor accident
http://documents.eu-japan.eu/seminars/reports/seminar_20110629_fdi_ja.pdf
http://en.wikipedia.org/wiki/Cost_of_electricity_by_source [Nuclear is costlier than many sources]
http://www.renewables-info.com/interesting_energy_articles/solar_energy_vs_nuclear_energy_-_comparison_in_prices.html[Solar Energy is now chepaer than Nuclear Power.Why ?]
http://www.ccohs.ca/oshanswers/phys_agents/ionizing.html [Conversion of Bq into mSv, Btu]
65 Bq/Cum 1Milli Joule-hr/Cum 1.1 milli-Sieverts
http://www.civildefensemuseum.com/southrad/conversion.html (conversion table)
http://www.civildefensemuseum.com/southrad/conversion.html (conversion table)
http://www.unitconversion.org/unit_converter/energy.html (Energy converters)
http://www.ans.org/misc/FukushimaSpecialSession-Caracappa.pdf [ Dose Calculations,Fukushima]
www.morehead.unc.edu/revitalise/feb/envsciexcel.html (Software of Gaussian Plume Model)Click on :Download the Excel model. (software used for calculations of accident scenario)
http://saarc-sdmc.nic.in/pdf/india/file4.pdf (Govt.of India NIDM report on disaster management)
http://saarc-sdmc.nic.in/pdf/india/file5.pdf (Risk Management,NIDM GOI)
http://saarc-sdmc.nic.in/pdf/india/file6.pdf (Disaster Management,NIDM,GOI)
http://saarc-sdmc.nic.in/pdf/india/file2.pdf (Disaster Management, Advise to states,NIDM,GOI)
http://cwc.gov.in/main/downloads/EAPChapters.pdf (EAP report for dam burst scenario,GOI)
http://bhujangam.blogspot.com/2011/08/economic-costs-of-nuclear-reactor_05.html
http://bhujangam.blogspot.com/2011/08/unsafe-nuclear-reactors-in-india.html
http://bhujangam.blogspot.com/2011/08/unsafe-nuclear-reactors-in-india.html
(Americans were directed to evacuate all places upto about 50km from the reactor during emergency )
http://www.gitam.edu/GIS/shivajirao_dckn.htm
(For the socio-economic impacts of Kovvada Nuclear accident analysis must be made on the guidelines provided in the above website that contains the data for the nuclear accident at Sizewell reactor)
AS AN IRRITATED SNAKE KILLS A MAN, NUCLEAR PLANTS SILENTLY KILL MANKIND AND NATURE FOR FINANCIAL GAINS BY CONTRACTORS,OFFICIALS& POLITICIANS ?
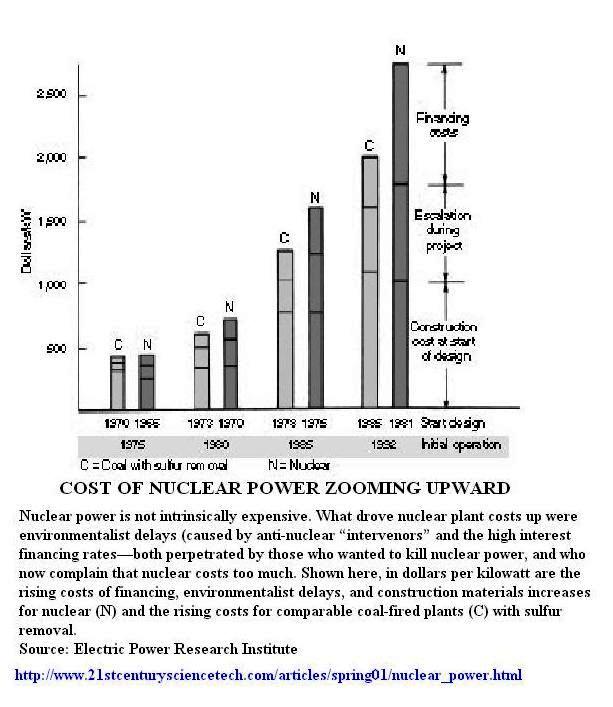
Nuclear Plants are just silent killers of man and Nature created by the GOD. In nature the Uranium ore contains 99.3% of Uranium-238 and the remaining 0.7% is Uranium-235. Uranium-238 and Uranium-235 in nature are least harmful. But business people and other vested interests dig the iron ore and convert the least harmful Uranium-235 into the fuel form of Uranium-235 by purifying it to make a fuel by enriching it to about 4% of Uranium-235 that is packed in pellets and inserted into the core of the nuclear reactor for producing both electricity and material for making the bombs. The reactor when the nuclear atom is given a blow by a neutron, enormous heat and other poisonous Radio-active atoms like Xenon, Barium, Cesium, Strontium, Plutonium and other dangerous radioactive substances are produced. These radioactive substances are discharged into the air and water by several ways and when they enter into the environment consisting of air, water and soil and foods like vegetables, fishes, prawns they ultimately get into human beings and produce cancers and birth defects in generations of people for many decades to come. These poisonous radioactive substances destroy natural and human life and culture and convert lands upto hundreds of kilometers into permanent nuclear burial grounds for ever.
How harmless Uranium ore materials in nature are converted into destructive and killer materials by man can be understood by the following simple example. For instance king cobras live in nature in anthills in forests and lead their normal life peacefully by catching their prey for food during nights But greedy people go and poke their iron rods into their abodes and disturb the Cobras when they become angry and bite the trespassers to inflict death over them by their poisons. Similarly, the selfish people are mining the harmless Uranium and converting it into harmful Enriched Uranium and then using it to produce electricity by means of the Nuclear plants and in the process they are producing Radioactive pollutants that poison man and nature slowly due to routine releases of radioactivity into the environment. In course of time if an accident occurs in the Nuclear plant due to several reasons like in Fukushima or Chernobyl, the poisonous pollutants are thrown into the atmosphere and they kill thousands of people slowly and inflict cancer to millions of people living downstream upto hundreds of Kilometers as in case of Fukushima and Chernobyl accidents. The Nuclear plant operators are misleading the public by stating that Nuclear power is safe and cheap just like the medical representatives of various pharmaceutical companies praise before the doctors about the virtues of their medical tablets and tonics as part of their sale promotion activity the nuclear authorities are praising the nuclear plants as safe and cheap energy producers which is wrong. This misinformation is dangerous to public health and welfare because in European states almost all people agree that safety of Nuclear (power is a Myth as accepted by Angela Merkel, Chancellor of Germany. She had consulted the genuine experts on nuclear plants and realized that nuclear safety is a myth and ordered for gradual closure of all the nuclear plants in Germany. If Indian Prime Minister and Union Cabinet Ministers including the Chief Ministers of the state want to know the truth about the safety of the nuclear power plants they must go and visit advanced countries like Germany and Japan and discuss the issue with foreign experts so that they can refrain from promoting nuclear plants as is done by the peoples leader like Mamata Banerjee, Chief Minister of West Bengal. For more scientific details see the above web sites on this topic prepared by independent experts.
Environmental Impact Analysis report are fabricated by consultants according to the national Green Tribunal and also according to the Chief Justice of India, S.H.Kapadia who said “If you leave report preparation to the project proponent, I am sorry to say the person who pays will get the answers he asks for” and hence he called for a change in the system of preparation of EIA reports for the development projects. See website: http://www.thehindu.com/news/national/article2886141.ece
Supreme Court judges Douglas and Black described Nuclear power as “a most deadly, a most dangerous process that man has ever conceived”. In fact the radioactive pollutants are a million to billion times more toxic than many chemical poisons. Many experts emphasize that nuclear power proliferation is a serious threat to mankind meriting comparison with nuclear war. But some people believe that it holds the key to national energy and defence problems and is clean, safe and cheap. However, the former head f U.S. Nuclear establishment David Lilienthal belatedly admitted in 1981 that “nuclear technology is not really so advanced; it is not dependable enough; it is not safe enough”. Even the Russian expert Legasov posed the questions: “Is not the development of nuclear energy on an industrial scale premature? Will it not be fatal to our civilization, to the eco-system of our planet?
The Chernobyl disaster and the Fukushima Reactor explosions actually proved that even highly disciplined developed nations like Russia and Japan could destroy their own human and natural resources and those of other neighbouring nations without a war just by accidental mismanagement of the so called peaceful uses of the atom.
In the light of the harrowing experiences from Chernobyl and Fukushima disasters most of the countries in Europe have decided against nuclear power in preference to renewable energy sources like wind, solar, and biomass and some countries like Japan and Germany have chosen to close down the existing reactors in a phased programme. At this juncture, the Government of India has launched a major expansion programme in nuclear power. Karnataka, Maharashtra, Andhra and Tamil Nadu will be affected by this project.
1. REACTORS AT KOVVADA: As a part of this nuclear development programme the Government of India proposes to establish a nuclear plant at Kovvada in Srikakulam Dist., with an initial capacity of 10,000 MW inspite of continuing public agitations in the locality against the nuclear power plants. In this context it is proposed to highlight the highly damaging impacts of the proposed nuclear plant at Kovvada so that the state and central Governments can plan for alternate sources of electricity development by making use of renewable energy resources as per the suggestions continued in the Greenpeace report the European countries and also the natural gas that is abundantly available on the East and West coast of India as can be seen under the websites: http://www.thehindu.com/opinion/op-ed/article1770465.ece
http://www.greenpeace.org/international/Global/international/publications/climate/2011/battle%20of%20the%20grids.pdf [Alternate Renewable Energy Sources available for European countries]
Nuclear power stations produce unusual amount of heat by means of nuclear reactions of Uranium fuel particles bundled in packets and placed in reactor core where neutrons bombard the fuel and thereby abnormal heat and new radioactive particles which damage living tissues are produced. If the nuclear fuel gets overheated and the packed radioactive particles are blown into the air the surrounding areas including the air, water, soil get highly poisoned and the cost of such an accident will be very high.
Firstly the local population would be exposed to radiation from the radioactive plume from the reactor and the local soils and buildings also will be contaminated causing deaths including cancer even for future generations. Crops and agriculture products exposed to radioactive pollutants will be poisoned and people and animals have to be evacuated from the local areas to safer places for several years. This report attempts to evaluate some of the consequences caused by radioactive pollutants arising from accidents in nuclear power plants.
For this purpose the proposed Kovvada Nuclear Plant with 10000 MW pressurized water reactors is taken as model from United Kingdom.
This reactor produces 3100 MW of heat at full power the nuclear reaction is driven in 100 tonnes of Uranium Oxide fuel in 50,000 packed fuel rods are tubes of Zirconium alloy, ½ inch in diameter. The reactor core sits in a thick steel pressure vessel, through which 18 tonnes of is pumped every second to carryaway the heat which is used for generation of high pressure steam that drives the turbine that is linked with the generator that produces electricity. During operations fuel rods are kept at 340oC by circulating cooling water that removes heat from the rods and if this flow of cooling water is blocked for any reason fuel temperature rises to 1200oC and the Zirconium tubes began to melt and with the core getting melted the fuel along with massive quantities radioactivity breaches all the barriers and forces its way into the atmosphere. Reactor systems will be provided with means to flood the reactor core in emergencies to avoid core meltdown and to maintain the integrity of the containment. If the emergency core cooling system fails a cloud of radioactivity will enter the atmosphere and will carried by the wind, depositing fission products of the core in a ribbon downwind of the reactor in decreased concentration for hundreds of miles from the reactor. Health hazards occur due to this radioactive contamination of air, water and soil causing physical, economic and social damages in the zone of influence. The dosages of radioactivity in the environment are estimated and necessary steps are taken as preventive and curative measures in sheltering the people administering medicines and evacuating people to safe zones within specified time schedules. Similarly the damage to agricultural crops, milk products are also assessed for taking public health protection measures. Some of the details of this emergency response system of the Nuclear reactor are presented in the following paragraphs.
EXPOSURE PATHWAYS:
Contact with radioactivity can lead to exposure to radiation through a number of exposure pathways, for instance direct exposure ingestion or inhalation. Direct exposure refers to a situation where exposure occurs from radiation emitted by radioactive substances outside the body. After a nuclear accident, for example, this may result from radioactivity which is suspended in the air, from radioactive contamination of the ground or the surface of buildings. Ingestion of radioactivity will occur if contaminated foodstuffs are eaten or drunk, and will result in the incorporation of radioactivity into the body. Inhalation will result in radioactive particles lodging in the lungs, causing radiation exposure to the lungs, and certain radioactive elements passing through the lungs into the blood.
When radioactive elements are inhaled or ingested, the body will treat them in the same way as normal elements. Since particular elements tend to be concentrated in particular organs, the same increased concentration will occur if these elements are radioactive. Normal iodine, for example, is concentrated in the thyroid gland, and if radioactive iodine is ingested or inhaled, this causes a high concentration of radioactive iodine in the thyroid, and a correspondingly high chance of contracting thyroid cancer.
The amount of iodine ingested is of particular importance to the calculation of the consequences of nuclear accidents, since a large amount of radioactive iodine is produced in nuclear reactors, and it is very volatile which means it will be released in large quantities. Similar effects will result from ingestion of other radioactive elements; for instance plutonium, if ingested, tends to concentrate in the bones.
HARMFUL EFFECTS OF RADIATION
Effects
|
Dose/Effect Relationship
|
Early effects
-Death
- Radiation sickness (prodomal vomiting)
-Sterility
- Cataracts
- Skin damage, hair loss
|
High dose (> 200 rads) to bone marrow (or lungs, etc.); depends on dose and dose rate
Depends on dose and dose rate
|
Late Effects
-Malignant diseases (fatal cancers, leukemia, non-fatal cancers to organs such as breast, thyroid, etc.
-Hereditary effects
-Developmental effects
|
‘Risk factors’ determined for different organs and for the whole body. Normally assumed risk of fatal cancer ~ 1 per 10,000 rems collective dose (to a population).
Risk factors determined (~ 2 effects per 10,000 rems gonad irradiation).
Results from irradiation of embryo before birth. Effects unknown.
|
REACTOR FAILURE MODES:
Emission factors known as source terms are essential to evaluate moment of poisonous nuclear radioactivity between the core of the reactor and the external environment downwind of the reactor. Figure shows types of barriers in the nuclear plant which must be broken to permit the escape of pollutants in the environment. Fuel matrix is the first barrier and fuel cladding is the second barrier and these fail when heated upto 2000oC or more. The coolant system is the 3rd barrier and the containment building is the 4th barrier. In Light Water Reactor (LWR) and Liquid Metal Fast Breeder Reactor (LMFBR). The reactors are housed in strong buildings. Pollutants sometimes by-pass the containment also. At Chernobyl first 3 barriers failed in the initiating reactivity excursion and as there was no strong containment building flimsy reactor housing was promptly thrown out. At Three Mile Island first 3 barriers were damaged and the containment is the 4th barrier retained most of the pollutants except for a trace of reactivity that escaped from the core. An example of the various stages of failure, grouping together the individual sequences of system failures, plant damage, accident phenomena and similar source terms are presented hereby a containment Event Tree (Fig) for a nuclear Reactor. Core of an 1000 MW Reactor contains several thousand million curies of radioactivity at the onset of an accident and many powerful barriers must be breached before the pollutants escape into the atmosphere and establishing the timing and nature of breaches is essential part of source term analysis which is linked to sequence definition. The reactor safety study methodology used by Westinghouse source term analysis for the nuclear Reactor includes nil treatment of transport through the reactor coolant system and the Event Tree and categorization deal only with events of the reactor containment and behavior of its safety systems. Five nodes deal how containment response by examining the time and mode of its failure or by-pass. Remaining 3 nodes deal with behavior of the radio-nuclides, questioning whether they release mechanisms of steam explosion or vaporization occur or whether operation of containments sprays is washing radioactivity out of the containment atmosphere. The characteristics of 4 of the 12 release categories for Sizewell reactor are presented in the table for a comparision, 1)containment by-pass (UK1), or 2) Early failure UK2 3) delayed failure UK5, 4) Intact containment UK11. The accidents are 1)Large Break, LOCA, 2)small break LOCA, 3) Transient initiated accident. Three Mile Island had transient type accident with core cooling being recovered.
SOURCE TERMS[ACCIDENT EMISSIONS of RADIOACTIVITY] based on U.S.WEB :http://www.nucleartourist.com/events/NUREG-1465.pdf [ U.S. Methodologiesa followed]
http://en.wikipedia.org/wiki/Radioactive_contamination [ Radio=active pollutaion]
Table RELEASE CATEGORIES AND THEIR CHARACTERISTIC PARAMETERS FOR SIZEWELL REACTOR
Timing Characteristic
Release Category
|
Frequency of occurrence (Y-1)1
|
Time before release2 (h)
|
Duration of release3 (h)
|
Warning time 4 (h)
|
UK1
|
2.4 10-9
|
1
|
3
|
0
|
UK1C
|
1.4 10-9
|
1
|
3
|
0
|
UK9
|
5.2 10-9
|
2
|
10
|
1
|
UK11
|
6.2 10-7
|
2
|
Long9
|
1
|
Physical Characteristics
Release Category
|
Energy of release (106 Btu/h)
|
Elevation of release (m)
|
Fraction of core inventory released to environemnt5
| |||||||
Xe-Kr
|
Organic I
|
Inorganic I-Br6
|
Cs-Sb
|
Te-Sb
|
Ba-Sr
|
Ru7
|
La8
| |||
UK1
|
0.3
|
10
|
9 10-1
|
7 10-3
|
7 10-1
|
5 10-1
|
3 10-1
|
6 10-2
|
2 10-2
|
9 10-1
|
UK1C
|
0.3
|
10
|
9 10-1
|
7 10-3
|
1.3 10-1
|
1.3 10-1
|
7.5 10-2
|
1.5 10-2
|
5 10-3
|
1 10-3
|
UK9
|
0
|
0
|
3 10-1
|
2 10-3
|
8 10-4
|
8 10-4
|
1 10-3
|
9 10-5
|
7 10-5
|
1 10-5
|
UK11
|
0
|
10
|
6 10-2
|
3 10-5
|
3 10-5
|
3 10-5
|
3 10-5
|
3 10-6
|
2 10-6
|
4 10-7
|
NOTES FOR TABALE 1:
1. As estimated in studies done / commissioned by, the CEGB (Central Electricity Generation Board)
2. The time between reactor shut-down and the release of radioactivity to the environment
3. For the purposes of this assessment the duration of releases UK1 and UK1C are taken as 1 hour, as over 90% of the activity released occurs within this time
4. The warning time is the time available for the initiation of counter measures before the release of activity to the environment. It has been evaluated conservatively as the time between vessel melt through and the release of activity to the environment.
5. The specified fractions of the core are assumed to be released uniformly over the specified release during (See note3) . The release fractions apply to stable isotopes of the specified elements.
6. The iodine and bromine are assumed to be released in an elemental form
7. Includes Ru, Rh, Co, Mo and Tc
8. Includes Y, La, Zr, Nb, Ce, Pr, Nd, Np, Pu, Am and Cm
9. For this category the releases of Xe-Kr and organic I are protracted and may continue over some tens of days. The assumption is made in this study that the total release occurs in 10 hours.
Source: D.Charles, S.M.Haywood & G.N Kelly, ‘The Radiological Consequences of Postulated Accidental Releases from the Sizewell PWR in Particular Meteorological Conditions’, NRPB-M84, May 1983.
Table METEOROLOGICAL CONDITIONS USED FOR THE ACCIDENT SCENARIOS FOR SIZEWELL-B
Code Name
|
Atmospheric stability
|
Duration (h)
|
Pasquill category
|
Windspeed1
(m s-1)
|
Mixing layer depth1(m)
|
Rainfall rate (mm h-1)
|
D5
|
Neutral
|
Total
|
D
|
5
|
800
|
0
|
FD
|
Stable
|
t < 4 h
t > 4 h
|
F
D
|
2
5
|
100
800
|
0
0
|
DR
|
Neutral (Rain)
|
Total
|
D
|
5
|
800
|
1.0
|
Note: The Values assigned to the wind speed and mixing layer depth are representatives values for the corresponding Pasquill stability categories and have been taken from: R.H Clarke, ‘The First Report of a Working Group on Atmospheric Dispersion: A model for short and medium range dispersion of radio nuclides released to the atmosphere’, NRPB, Harwell, NRPB-R91, 1979. Pasquill categories are used to classify the degree of stability of weather conditions in order to distinguish the main atmospheric dispersion patterns of clouds emitted from land-based source.
EXAMPLES OF ACCIDENT SOURCE TERMS FOR DIFFERENT REACTORS
Sizewell B PRA Release
Categories
|
Start
|
Duration
|
Fraction of Core Inventory Released
| ||||||
Xe
|
I
|
Cs
|
Te
|
Ba
|
Ru
|
La
| |||
UK1
|
1 hr
|
3 hr
|
0.9
|
0.7
|
0.5
|
0.3
|
6(-2)
|
2(-2)
|
4(-3)
|
UK2
|
1 hr
|
0.5 hr
|
0.9
|
0.7
|
0.4
|
0.35
|
5(-2)
|
0.2
|
3(-3)
|
UK5
|
8 hr
|
0.5 hr
|
1.0
|
0.3*
|
0.3
|
0.5
|
4(-2)
|
3(-2)
|
6(-3)
|
UK11
|
2 hr
|
>24 hr
|
6(-2)
|
6(-5)
|
3(-5)
|
3(-5)
|
3(-6)
|
2(-6)
|
4(-7)
|
*Revised first estimate
| |||||||||
Chernobyl
|
0 hr
|
10 d
|
1.0
|
0.4
|
0.25
|
>0.1
|
4(-2)
|
5(-2)
|
3(-2)
|
TMI-2
|
3 hr
|
1 hr
|
<8(-2)
|
2(-7)
|
0
|
0
|
0
|
0
|
0
|
Note: 3(-3) = 3 x 10⁻³
| |||||||||
IMPORTANT RADIONUCLIDES AND TYPICAL CORE INVENTORIES FOR SIZEWELL
Group
|
Nuclides
|
T ½
|
Core Inventory, 1100MWe Reactor Mega-Curies
| |
Thermal
|
LMFBR
| |||
Xe
|
Xell-113
|
502d
|
185
|
173
|
I
|
I-131
|
8.04d
|
91
|
95
|
I-133
|
20.8h
|
184
|
169
| |
Cs
|
Cs-134
|
2.06y
|
10.4
|
1.7
|
Cs-137
|
30.0y
|
6.2
|
2.6
| |
Te
|
Sb-127
|
3.9d
|
7.9
|
8.9
|
Te-132
|
3.2d
|
131
|
125
| |
Ba
|
Sr-89
|
50.5d
|
91
|
48
|
Sr-90
|
29.1y
|
4.7
|
1.0
| |
Ba-140
|
12.7d
|
166
|
133
| |
Ru
|
Mo-99
|
66h
|
174
|
52
|
Ru-103
|
39.4d
|
142
|
72
| |
Ru-106
|
368d
|
35
|
49
| |
Rh-105
|
1.5d
|
86
|
38
| |
La
|
Y-91
|
58.6d
|
122
|
68
|
Zr-95
|
65.5d
|
159
|
19
| |
Nb-95
|
35.1 d
|
157
|
16
| |
La-140
|
40.3 d
|
171
|
136
| |
Ce-141
|
32.5 d
|
160
|
143
| |
Ce-143
|
33.0 d
|
147
|
118
| |
Ce-144
|
285 d
|
97
|
41
| |
Pr-143
|
13.6 d
|
146
|
118
| |
Nd-147
|
11.0 d
|
64
|
55
| |
Np-239
|
2.36 d
|
1976
|
1966
| |
Pu-241
|
14.4 d
|
8.6
|
24
| |
Cm-242
|
153 d
|
1.8
|
5.8
| |
EFFECT OF LOCATION ON THE NUMBER OF FATAL CANCERS: SOME EXAMPLES FROM NRPB SENSITIVITY ANALYSIS(0) FOR SIZEWELL REACOTR
Type of release
|
Weather conditions (wind direction:270o)
|
Relocation limited to evacuation area
|
Relocation extended to areas in which reference dose criteria is reached
| ||||
No. of late cancer
|
Time interval of relocated people (person-years)
|
No.of people relocated (persons)
|
No. of late cancers
|
Time interval of relocated people (person-years)
|
No.of people relocated (persons)
| ||
R1(1)
|
M1(3)
M2(2)
|
4,936(5)
25,450
|
108,000
5,570,000
|
12,900(6)
198,000
|
4,760
12,040
|
150,000(7)
10,200,000 |
22,000
718,000
|
R2(2)
|
M1
M2
|
2,067
14,730
|
36,800
1,470,000
|
4,740
44,000
|
2,045
10,990
|
580,000
5,630,000
|
9,400
360,000
|
Source: NRPB-M103, tables 8,9,10, pp39-41
(0)methodology and parameters comparable to those used in this study
(1)comparable to UK1
(2)of the same type as UK1c,but with different parameters
(3)M1 is the same as D5 used here
(4)M2 is equivalent to M1, but with 1mm x h-1rain after 3 hours
(5)in the NRPB estimate for this study, this figure is 7,050
(6)in our estimates (See Appendix 1, Table 3) the number of people evacuated in 14,000
(7)Our estimate is 265,000 because of slightly different return criterion and different geographical distribution
grid
(8)our estimate is 18,500
TABLE -3 TYPE OF ACCIDENT: (UK-1)
Wind direction (North:0o, clockwise)
|
Weather Conditions:D5
|
Weather Conditions: FD
|
Weather Conditions: DR
| |||||||
270o
|
240o
|
210o
|
270o
|
240o
|
210o
|
270o
|
240o
|
210o
| ||
1*.Sheltering1: Surface area2
Maxi. distance from reactor
Population concerned
|
Sq.km
Km
Persons |
2,700
160
450,000 |
2,700
160
245,000 |
1,450
160
115,000 |
820
74
110,000 |
820
74
205,000 |
415
74
130,000 |
4,350
170
725,000 |
4,350
170
4,500,000 |
2,600
170
1,000,000 |
- Evacuation: : Surface area
Maxidistance from reactor
Population concerned
|
Sq.km
Km
Persons |
100
28.5
14,000 |
100
28.5
18,500 |
89
28.5
6,500 |
255
37
22,000 |
255
37
72,000 |
190
37
25,500 |
880
85
115,000 |
880
85
225,000 |
335
62
110,000 |
2.*
- Relocation :
Surface area
Max.distance from reactor
Population concerned
|
Sq.km
Km
Persons
|
200
46
18,500
|
200
46
93,000
|
145
37.5
25,000
|
385
41
28,000
|
385
41
150,000
|
260
38.5
32,000
|
2,700
140
420,000
|
2,700
140
1,500,000
|
1,400
140
545,000
|
3* Decontamination
Surface area
Max. distance from reactor
Population concerned
| Sq.km
Km
Persons
| 75
28.5
13,000
| 75
28.5
11,000
| 73
28.5
4,650
| 330
41
25,000
| 330
41
145,000
| 220
38.5
30,500
| 1,900
115
295,000
| 1,900
115
500,000
| 760
115
235,000
|
4* :Decontamination
Surface area
Max.distance from reactor
Population concerned
|
Sq.km
Km
Persons |
14.5
13
6,200
|
14.5
13
1,700
|
14.5
13
1,950
|
175
31.5
17,500
|
175
31.5
23,500
|
145
31.5
8,500
|
700
76.5
99,000
|
700
76.5
200,000
|
315
62
57,500
|
Time-integral of relocation : Surface area
Population concerned
|
Sq.km-years
Persons years
|
1.45 x 10³
2.65 x 10⁵
|
1.45 x 10³
3.85 x 10⁵
|
1.4 x 10³
1.45 x10⁵
|
6.9 x 10³
7.2 x 10⁵
|
6.9 x 10³
1.95 x 10⁶
|
5.5 x 10³
5.9 x 10⁵
|
3.7 x 10⁴
5.25 x 10⁶
|
3.7 x 10⁴
1.2 x 10⁷
|
1.7 x 10⁴
5.3 x 10⁶
|
5*. Health effects
early deaths
- late deaths (cancer)
|
44
7,050
|
792
20,500
|
23
3,600
|
725
5,650
|
4,610
14,300
|
342
2,920
|
431
9,670
|
2,840
39,700
|
151
8,310
| |
1*Potential Sheltering1: Consequences of emergency counter-measures
2*Consequences of emergency counter-measures:Relocation of population prior to 3*decontamination:Decontaminated area still not re-inhabited after 5 years 4* Decontaminated area still not re-inhabited after 20 years
5*Health effects – as estimated by NRPB3: -
NOTES FOR TABLE 3: 1. This ‘potential sheltering’ corresponds to the application of NRPB countermeasures recommendations in ERL-2. In the calculation of health consequences, sheltering is considered only in the evacuation area, prior to evacuation. 2. ‘Surface areas’ in this Table are land areas only. 3. These health effects have been computed by the NRPB considering only evacuation as a counter-measure. Sheltering is assumed to be required only for evacuated people, prior to evacuation. No specific relocation model is used, but it is assumed that source after evacuation (this implicitly corresponds, relocation).
NOTES FOR TABLE 3: 1. This ‘potential sheltering’ corresponds to the application of NRPB countermeasures recommendations in ERL-2. In the calculation of health consequences, sheltering is considered only in the evacuation area, prior to evacuation. 2. ‘Surface areas’ in this Table are land areas only. 3. These health effects have been computed by the NRPB considering only evacuation as a counter-measure. Sheltering is assumed to be required only for evacuated people, prior to evacuation. No specific relocation model is used, but it is assumed that source after evacuation (this implicitly corresponds, relocation).
BASIC CHARACGTERISTICS OF THE COUNTERMEASURES MODEL
ZONE
|
Criterion for countermeasures
|
Extent of Zone
|
Distance downwind
|
Time taken to execute countermeasure1
| ||
Shelter 2, 5 in evacuated areas
|
Evacuate 3,5
|
Relocate 5
| ||||
A
|
Major release of activity to containment
|
60o sector extending 2km downwind
|
0-2km
|
1h
|
2h
|
-
|
B
|
Major release of activity containment
|
60o sector extending 2 to 5 km downwind
|
2-5km
|
1h
|
5h
|
--
|
C
|
Bone marrow dose from all exposure pathways exceeds 0.25 Sv in 7 days4
|
Determined by area over which criterion exceeded
|
5-25 km
25-75km
> 75 km
|
6h
6h
6h
|
12h
1d
2d
|
-
-
-
|
D
|
Whole body y dose from deposited material exceeds 0.25Sv in first year
|
Determined by area over which criterion exceeded
|
5-50km
>50km
|
--
--
|
--
--
|
2d
2d
|
NOTES FOR FIGURE1:
1. The times specified are the intervals between the inititation of the countermeasures and their completion. For areas A and B the time is measured relative to the beginning of the warning time (the beginning of the warning time is taken as the occurrence of vessel melt-through and the durationof the warning time is the period between vessel melt-through and a significant release of activity to the environment (see Table 1 in Appendix)
For area C the time is measured relative to the release of activity to the environment (i.e. no credit taken for warning time)
2. For areas A, B, and C, 90% of the population are assumed indoors and 10% outdoors at the time of the release. Sheltering considered here (which affects only the population which would be evacuated) is assumed to cover the whole population, at the specified time. However, it is possible that, following the NRPB official recommendations expressed in ERL 2, the extent of shelterisng would be far wider and cover more than the population to be evacuated in the following hours or day. In Table 3 of Appendix 1, for instance figures are presented on the possible extent of sheltering order using an exposure criteria of 15 mSv to the bone marrow in 7 days. (this criteria is in the middle of the range recommended by NRPB in ERL2, as shown in Table3, Chapter2). The extent of sheltering would in this case be obviously far wider than the alternative in which only the population to be vacuated would be asked to take shelter. Note that the health effects calculated by the NRPB do not take into account this possible supplementary cou8ntermeasures, nor the intake of iodine tablets.
3. The exposure during evacuation is taken to be approximately that which would have been received outdoors in the following hour had evacuation not occurred.
4. The dose to be used in conjunction with this criterion is evacuated assuming people to be outdoors during the passage of the plume and subsequently to spend 90% of their time indoors and 10% outdoors.
5. Those evacuated or relocated are returned to the affected area when the annual wholedboy v dose from deposited material is less than 10mSv per year after decontamination (assumed to reduce radioactivity levels by a factor of 3)
Source: G.N.Kelly, L.Ferguson, D.Charles,’the Influence of countermeasures on the Predicted Consequences of Degraded Core Accidents for the Sizewell PWRm NRPB-R163, December 1983, p42 Fig.1

OFFICIAL NRPB RECOMMENDATIONS FOR THE IMPLEMENTATION OF EMERGENCY MEASURES: EMERGENCY REFERENCE LEVELS (ERLs)
(dose equivalent levels in mSV)(1)
Counter-measures
|
Lower Value to:
|
Upper Value to:
| ||||
Whole body
|
Thyroid, lung or other single organ
|
skin
|
Whole body
|
Thyroid, lung or other single organ
|
skin
| |
Evacuation
|
100
|
300
|
1,000
|
500
|
1,500
|
5,000
|
Sheltering
|
5
|
50
|
50
|
25
|
250
|
250
|
Distribution of stable iodine tablets
|
--
|
50
|
50
|
--
|
250
|
--
|
(1) : 1mSv = 0.1rem; 1Sv=100 rems
Source: NRPB, Emergency Reference levels: Criteria for limiting doses to the Public in the Event of Accidental Exposure to Radiation, ERL-2, July 1981, p.4
SHORT TERM EFFECTS OF EXPOSURE ON POPULATION HEALTH AND THE EFFECTS OF EMERGENCY COUNTERMEASURES: FOUR EXAMPLES OF SELECTED SCENARIOS (1)
Release type
|
Weather condi-tions
|
Wind direc-tion
|
No. of early deaths
|
No. of prodomal vomiting
(2)
|
Area evacuated (sq.km)
|
Max. distance (A)
|
people evacua-ted
(B)
|
shelter- Area (3)
(C )
|
persons sheltered (3)
(D)
|
UK1
|
FD
|
270O
|
725
|
2,300
|
255
|
35
|
22,000
|
820
|
205,000
|
Uk1c
|
D5
|
240O
|
0
|
2
|
17.5
|
8.6
|
5,350
|
325
|
155,000
|
Uk9
|
DR
|
210O
|
0
|
0
|
12.5
|
5
|
1,100
|
23
|
3,200
|
UK11
|
D5
|
240O
|
0
|
0
|
13
|
5
|
4,750
|
13
|
4,750
|
A) Max. distance of evacuation(km)
B) No. of people evacuated
C) Area of sheltering using NRPB’s ERL-2 criteria
D) Total No. of persons sheltering using NRPB’s ERL-2 criteria
(1): Results for all 36 scenarios can be found in Appendix1, Tables 3 and 5. Criteria for countermeasures described in Table 4.
(2) Not estimated by NRPB; evaluated by using the ratio between early deaths and prodomal vomiting in each type of release in NRPB –R137. The number of people suffering from prodomal vomiting includes those who will die. Figures are estimated after taking into account counter-measures implementation.
(3) Includes the number of people or area which will be evacuated some hours afterwards (shown in above columns 8 and 6) as well as those people or areas for which no evacuation will take place but for which the exposure dose is within the range defined in NRPB’s ERLs for sheltering. The latter group taking shelter are not considered in estimating early health effects.
Note-1: Small accidents like UK9 and UK11 according to calculations do not cause early deaths but cause a few cases of prodomal vomiting.
Note-2: In case of large accidental releases like UK1 and UK1C early health effects are same for UK1 with weather conditions FD (Low wind, high pressure, cloudy summer) Easterly wind causes 725 deaths in a short time and 2300 people suffer serious effects or die and many people in Leiston would become sick a few hours with passage of the plume. For small releases of UK9 and UK11 evacuation and sheltering is done as a precautionary measure upto 5km and emergency plans made upto 3km
Note-3: For large releases like UK1 and UK1C evacuation is done for a few thousand people to more than 2 lakh population. If winds blowout towards London at 240oC 45 lakh people need counter measures.
For Chernobyl accident largest releases occurred. All of the noble gas and major fractions of volatile fission products were released on 26th April in Stage-I the initiating in-core transient blew off the pile cap and ejected fragments of hot fuel along with volatile fission products directly into the environment. 5% of core elementary of volatile fission products and 0.3% to 0.4% of the non-volatile nuclides were released to the atmosphere. In second stage from 26th April to 2nd May in-core fires mainly of the moderative graphite promoted continuing releases from 26th to 27th. On 27th dumping of lead, dolomite, clay and sand heaps on to the core debris caused steady reduction in radioactive releases until 2nd May and the fuel temperatures were around 800oC . But in the 3rd stage from 3rd to 5th May core temperatures rose to 2000oC caused by decay heat when a second peak release occurred on May 5th. Revolatalisation of material trapped earlier in the filter bed perhaps caused high releases. During the 4th stage on May 6th radioactive release reduced due to injection of high flows of nitrogen under the core debris and termination of fuel oxidation drastically reduce emissions of 50 mega curies of released radioactivity was present in the environment
CONSEQUENCES OF RADIOACTIVE RELEASES FROM KOVVADA NUCLEAR STATION ON THE POPULATION:
Main results of the countermeasures scenario, using the MARC model
( For weather conditions referred to the table presented below)
TABLE -3 TYPE OF ACCIDENT: UK1
Wind direction (North:0o, clockwise)
|
Weather Conditions:
DR 240o
| |
1. Consequences of emergency counter-measures
- Potential Sheltering1: Surface area2
Maximum distance from reactor
Population concerned
|
Sq.km
Km
Persons
|
3,000
150
50,00,000
|
- Evacuation: : Surface area
Maximum distance from reactor
Population concerned
|
Sq.km
Km
Persons
|
800
75
30,00,000
|
2. Consequences of emergency counter-measures
- Relocation of population prior to decontamination:
Surface area
Maximum distance from reactor
Population concerned
|
Sq.km
Km
Persons
|
2,000
110
25,00,000
|
Decontaminated area still not re-inhabited after 5 years :
Surface area
Maximum distance from reactor
Population concerned
|
Sq.km
Km
Persons
|
1,500
120
500,000
|
Decontaminated area still not re-inhabited after 20 years :
Surface area
Maximum distance from reactor
Population concerned
|
Sq.km
Km
Persons
|
700
77
20,00,000
|
3. Health effects – as estimated by NRPB3:
- early deaths
- late deaths (cancer)
|
3,000
50,000
|
NOTES FOR TABLE 3: 1. This ‘potential sheltering’ corresponds to the application of NRPB countermeasures recommendations in ERL-2. In the calculation of health consequences, sheltering is considered only in the evacuation area, prior to evacuation. 2. ‘Surface areas’ in this Table are land areas only. 3. These health effects have been computed by the NRPB considering only evacuation as a counter-measure. Sheltering is assumed to be required only for evacuated people, prior to evacuation. No specific relocation model is used, but it is assumed that source after evacuation (this implicitly corresponds, relocation).
METEOROLOGICAL CONDITIONS USED IN ESTABLISHING THE ACCIDENT SCENARIOS
Code Name
|
Atmospheric stability
|
Duration (h)
|
Pasquill category
|
Windspeed1
(m s-1)
|
Mixing layer depth1(m)
|
Rainfall rate (mm h-1)
|
D5
|
Neutral
|
Total
|
D
|
5
|
800
|
0
|
FD
|
Stable
|
t < 4 h
t > 4 h
|
F
D
|
2
5
|
100
800
|
0
0
|
DR
|
Neutral (Rain)
|
Total
|
D
|
5
|
800
|
1.0
|
Note: The Values assigned to the wind speed and mixing layer depth are representatives values for the corresponding Pasquill stability categories and have been taken from: R.H Clarke, ‘The First Report of a Working Group on Atmospheric Dispersion: A model for short and medium range dispersion of radio nuclides released to the atmosphere’, NRPB, Harwell, NRPB-R91, 1979. Pasquill categories are used to classify the degree of stability of weather conditions in order to distinguish the main atmospheric dispersion patterns of clouds emitted from land-based source.
RISK ANALYSIS OF KOVVADA REACTOR ACCIDENT : REMEDIAL MEASURES SCENARIO
(Due to the reactor accident at Kovvada the following villages and towns will be facing the risks of pollution)
Distance from reactor
|
Time taken to execute counter measures
|
Places effected due to UK1/DR/240
(For weather conditions see table above)
| |
Sheltering
|
Evacuation
| ||
0 - 2 km
|
1 hr
|
2 hr
|
Kovvada, Tekkali
|
2- 5 km
|
1 hr
|
5 hr
|
Narava, Mentada, Akkayyapalem, Saduvalasa
|
5 - 30 km
Zone-A
|
6 hr
|
12 hr
|
Temadam, Santapalli, Vempadam, Pativada, Marrivalasa, Chinnapativada, Kopperla, Perapuram, Gollapeta,Pasupam, Marrivalasa,Kottapeta, Erukonda, Nadipale, Teppavalasa, Konada, Bhogapuram, Nandigam, Ramachandrapeta, Padmanabham, Vijayarampuram, Maddi, Pandrangi, Korada, Majjipeta, Krishnapuram, Dakamarri, Santapeta, Vuppadapeta, Magadapeta, Gudepuvalasa, Mukkam, Bayareddipalem, Dharmasatram, Narayanarajupeta, Revidi, Majjivalasa, Gudivada, Chippada, Amanam, Palepalli, Ravada, Koyyavanipeta, Savaravilli, Orripeta, Tugidam, Dibbapalem, Gollalapalem,Naridipalem, Jiripalem. (All villages and towns upto Gabheeramgedda and Bheemili )
|
30 - 80 km
Zone-A
|
6 hr
|
1 day
|
Boni, Tatituru, Chittivalasa, Tallavalasa, Kummaripalem, Bheemunipatnam, Kusuluvada, Padugupalem, Chandaka, Nelateru, Peddipalem, Vemulavalasa, Vellanki, Boddupalem, Nerrelavalasa, Uppada, Sipulavanipalem, Gollapalem, Mangamaripeta, Kapuluppada, Boyapalem, Dukkavanipalem, Palavalasa, Anandapuram, Aichapuram, Bakarapalem, Gidijala, Tarluvada, Gudilova, Paradesipalem, Sontyam, Mindivanipalem, Kottavanipalem, Muchcherla, Relli, Gollala Kanamam, Ramavaram, Mamidilova, Doravanipalem, Bakkannapalem, Kottapalem, Chandrampalem, Madhuravada, Timmapuram, Rushikonda, Gajapatirajupuram, Gandigundam, Santapalem, Gollalapalem, Gurrampalem, Saripalli, Sowbhagyapuram, Dabbanda, Chemudupalem, Endada, Visakhapatnam(Sarada river)
|
80 – 120 km
Zone-B
|
6 hr
|
2 days
|
Anakapalli, Tummapala, Kasimkota, Bayyavaram, Munagapaka, Rajannapalem, Tantadi, Nunaparti, Dappalle, Atchutapuram, Dosuru, Uddapalem, Pudimadaka, Kondakarla, Panchadarla, Dharmavaram, Jerripalem, Bangarayyapeta, Bayyavaram, Gubburu, Cherlupalem, Maruturu, Gudijapalem, Lovapalem, Rambilli, Vadapalem, Kotturu, Elamanchili, Kokkirapalli, Narasingapalli, Tallapalem, Peddapalli, Erravaram, Dimili, Sarvasiddi, Upparapalli, Rayavaram, Gokulapadu, Vemagiri, Putaparti, Vegupalem, Venkatapuram (above Varaha river)
|
120 – 135 km
Zone-C
|
6 hr
|
2 days
|
Bhimavaram, Gotivada, Manyapalem, Ponduru, Ramachandrapuram, Etikoppaka, Darlapudi, Penugollu, Bhimavaram, Gumuluru, Koruprolu, Pata Polavaram, Gudivada, Lakshimipuram, Tinarala, Chandanada, Donivari Lakshmipuram, Doddigallu, Nakkapalli, Upamaka, Vempadu, Godicharla, Nellipudi, Gunupudi
|
135- 150 km
Zone-D
|
6 hr
|
2 days
|
Gopalapatnam, Bangarammapeta, Guttupalli, Devavaram, Uddandapuram, Namavaram, Maruvada, Dosalapadu, Rapaka, Mangavaram, Ramayyapeta, Payakaraopeta, Tuni, Talluru, Suravaram, Annavaram, Kandipudi, Bajavaram, Kumarapuram, Rajayyapeta, Kottapeta, Palvanipeta, Paidikonda, Yellaipeta, (above Tandava river near Tuni)
|
150 and above
Zone-E
|
6 hr
|
2 days
|
Pitapuram, Peddapuram, Samarlakota, Kakinada and other villages.
|
Note: Intervals between evacuation and reoccupation of original houses and lands after decontamination
Since the radio-active pollutants seriously pollute the lands, buildings and equipment, the people duly evacuated and rehabilitated in safer places, can return along with their cattle to their original homes in their native places only
1) after one year upto 140km from the nuclear plant
2) after 5 years upto 115km from the nuclear plant
3) after 10years upto 98km from the nuclear plant and
4) after 20 years upto 77km distance from the nuclear plant.

For larger size image see the following website: http://www.gitam.edu/GIS/shivajirao_dckn.htm
www.morehead.unc.edu/revitalise/feb/envsciexcel.html (Software of Gaussian Plume Model)
Click on :Download the Excel model. (software used for calculations of accident scenario)
http://www.irsn.fr/EN/Library/in-depth/Pages/indepth_The-Chernobyl-Plume.aspx
(animation of Chernobyl accident showing that poisonous fumes spread in all directions)
http://www.irsn.fr/EN/Library/in-depth/Pages/Indepth_chernobyl.aspx
http://www.irsn.fr/EN/Library/in-depth/Pages/indepth_The-Chernobyl-Plume.aspx
(animation of Chernobyl accident showing that poisonous fumes spread in all directions)
http://www.irsn.fr/EN/Library/in-depth/Pages/Indepth_chernobyl.aspx
(1 rem = 10 mSv (millisievert = one thousandth of a sievert)
1 sievert (Sv) = 100 rem.
1 sievert (Sv) = 100 rem.
-----------------------------------------------------------------------------------------
20 mSv : TLV for average annual dose for radiation workers, averaged over five years
Dose Acceptance Criteria
The committed whole-body dose for average members of the critical groups who are most at risk, at or beyond the site boundary is calculated in the deterministic safety analysis for a period of 30 days after the analyzed event.
This dose is less than or equal to the dose acceptance criteria of:
1. 0.5 millisievert for any anticipated operational occurrence (AOO); or
----------------------------------------------------------------------------------------
1 mSv : Recommended annual dose limit for general public (ICRP - International
Commission on Radiological Protection).
-----------------------------------------------------------------------------------------Dose Acceptance Criteria
The committed whole-body dose for average members of the critical groups who are most at risk, at or beyond the site boundary is calculated in the deterministic safety analysis for a period of 30 days after the analyzed event.
This dose is less than or equal to the dose acceptance criteria of:
1. 0.5 millisievert for any anticipated operational occurrence (AOO); or
2. 20 millisieverts for any design basis accident (DBA).
http://nuclearsafety.gc.ca/eng/lawsregs/regulatorydocuments/published/html/rd337/#P846_96932
http://nuclearsafety.gc.ca/eng/lawsregs/regulatorydocuments/published/html/rd337/#P846_96932
2.0
AERB Dose Limits for Members of the Public
The
estimated average doses to the relevant members of the public shall
not exceed the following limits:
- an effective dose of 1 mSv in a year;
- an equivalent dose to the lens of the eye of 15 mSv in a year; and
- an equivalent dose to the skin of 50 mSv in a year.
FAST FACTS: Nuclear Energy Institute
(NRI) http://www.nri.org/
103 nuclear power plants in 31 states in US.
US states with largest percentage of nuclear electricity:
Vermont - 76.1% / New Hampshire - 57.6% / South Carolina - 55.5% / Illinois - 51.6% / New Jersey 51.1% / Connecticut 50.5%
Largest US Nuclear Plant: Palo Verde 3 reactors 3,733 Megawatts / 12 largest in the world.
Reactor Manufactures: General Electric http://www.gepower.com/home/index.htm / Westinghouse http://www.westinghouse.com/ /Framatone http://www.framatech.com/ / Ases Brown Boveri Combustion Eng. http://www.abb.com/ (acquired by Westinghouse May 2000.
Worldwide nuclear electricity generation 16% from 439 reactors.
Power Generation Comparisons for 1-year:
Nuclear 1000 megawatt reactor @ 90% capacity
|
7.9 billion kilowatt hours supply (773,000 homes)
|
Oil 13.5 millions barrels
|
1-barrel yields 594 KWh
|
Coal 3.8 million short tons
|
1-ton yields 2,070 KWh
|
Natural Gas 82 billion cubic feet
|
100 cubic feet yields 9.62 KWh
|


Emergency Planning Zones for nuclear accidents as per United States Standards (80kms Zone):
To facilitate a preplanned strategy for protective actions during an emergency, there are two emergency planning zones (EPZs) around each nuclear power plant. The exact size and shape of each EPZ is a result of detailed planning which includes consideration of the specific conditions at each site, unique geographical features of the area, and demographic information. This preplanned strategy for an EPZ provides a substantial basis to support activity beyond the planning zone in the extremely unlikely event it would be needed.
The two EPZs are described as follows:
Plume Exposure Pathway EPZ
The plume exposure pathway EPZ has a radius of about 10 miles from the reactor site. Predetermined protective action plans are in place for this EPZ and are designed to avoid or reduce dose from potential exposure of radioactive materials. These actions include sheltering, evacuation, and the use of potassium iodide where appropriate. For more information, see Typical 10-Mile Plume Exposure Pathway EPZ Map.
Ingestion Exposure Pathway EPZ
The ingestion exposure pathway EPZ has a radius of about 50 miles from the reactor site. Predetermined protective action plans are in place for this EPZ and are designed to avoid or reduce dose from potential ingestion of radioactive materials. These actions include a ban of contaminated food and water.
http://www.nrc.gov/about-nrc/emerg-preparedness/about-emerg-preparedness/planning-zones.htmlINDIAN STANDARDS:
The AERB Code of Practice on Safety in Nuclear Power Plant Siting lays down desirable criteria for population for selection of a site as follows:
“Other desirable population distribution characteristics in plain terrain are:
i) Population centers greater than 10000 should not be within 10 km of the plant.
ii) The population density within a radius of 10 km of the plant should be less than 2/3 of the state average.
iii) There should be no population centres more than 100000 within 30 km from the plant.
iv) The total population in the sterilised area should be small, preferablyless than 20000.”
It may be reiterated that these are only desirable criteria and are prescribed to enable easy emergency planning.
For the purpose of planning for serious accidents, if any, an area of 16 km around the plant is considered as the Emergency Planning Zone. The AERB Code of Practice on Safety in Nuclear Power Plant Siting states:
During emergency, availability of transportation network means of communication, etc. which are of significance during emergency condition shall be checked. A radial distance of 16 km from the plant may be considered for this purpose.
http://www.npcil.nic.in/pdf/news_28sep2011_02.pdf
http://www.21stcenturysciencetech.com/articles/spring01/nuclear_power.html
DAILY ROUTINE RELEASES OF NUCLEAR POLLUTANTS FROM NUCLEAR PLANTS:
DAILY ROUTINE RELEASES OF NUCLEAR POLLUTANTS FROM NUCLEAR PLANTS:
1. It doesn’t take an accident for a nuclear power plant to release radioactivity into our air, water and soil. All it takes is the plant’s everyday routine operation, and federal regulations permit these radioactive releases.
2. Radioactivity is measured in “curies.” A large medical center, with as many as 1000 laboratories in which radioactive materials are used, may have a combined inventory of only about two curies.
In contrast, an average operating nuclear p o w e r r e a c t o r w i l l h a v e a p p r o x i m a t e l y 1 6 b i l l i o n c u r i e s i n i t s r e a c t o r c o r e .
This is the equivalent long-lived radioactivity of at least 1,000 Hiroshima bombs.
3. A reactor’s fuel rods, pipes, tanks and valves can leak. Mechanical failure and human error can also cause leaks. As a nuclear plant ages,so does its equipment – and leaks generally increase.
4. Some contaminated water is intentionally removed from the reactor vessel to reduce the amount of the radioactive and corrosive chemicals that damage valves and pipes. This water is filtered and then either recycled back into the cooling system or released into the environment.
5. A typical 1000-megawatt pressurized-water reactor (with a cooling tower) takes in 20,000 gallons of river,lake or ocean water per minute for cooling, circulates it through a 50-mile maze of pipes, returns 5,000 gallons per minute to the same body of water, and
releases the remainder to the atmosphere as vapor. A similar reactor without a cooling tower can take in as much as one-half million gallons per minute.
The discharge water is contaminated with radioactive elements in amounts that are not precisely tracked, but are potentially biologically damaging.
6. Some radioactive fission gases, stripped from the reactor cooling water, are retained in decay tanks for days before being released into the atmosphere through
filtered rooftop vents. Some gases leak into the power plant buildings’ interiors and are released during periodic “purges” or “ventings.” These airborne gases contaminate not only the air, but also fall out upon soil and water.
7. Radioactive releases from a nuclear power reactor’s routine operation often are not fully detected or reported. Accidental releases may not be completely verified or documented.
8. Accurate, economically-feasible filtering and monitoring technologies do not exist for
some of the major reactor by-products, such as radioactive hydrogen (tritium) and noble gases,such as krypton and xenon. Some liquids and gases are retained temporarily in tanks so that the shorter-lived radioactive materials can break down before the batch is released to the environment.
9. Government regulations allow radioactive water containing “permissible” levels of contamination to be released to the environment. Permissible does not mean safe. Detectors at reactors are set to allow contaminated water to be released,unfiltered, if below the “permissible” legal levels.
10. The Nuclear Regulatory Commission relies upon self-repor ting and computer modeling from reactor operators to track radioactive releases and their projected dispersion. A significant portion
of the environmental monitoring data is extrapolated – it’s virtual, not real.
11. Accurate accounting of all radioactive wastes released to the air, water and soil
from the entire reactor fuel production system is simply not available. The system includes uranium mines and mills, chemical conversion, e n r i c h m e n t a n d f u e l f a b r i c a t i o n p l a n t s ,nuc l e a r p owe r r e ac to r s, an d r adi o ac t i ve
waste storage pools, casks, and trenches.
12. Increasing economic pressures to reduce costs, due to the deregulation of the electric power industry, could further reduce the already unreliable monitoring and reporting of radioactive releases. Deferred maintenance can increase the radioactivity
released – and the risks.
13. Many of the reactor’s radioactive by-products continue giving off radioactive particles and rays for enormously long periods – described in terms of “half-lives.” A radioactive material gives off hazardous radiation for at least ten half-lives. One of the
radioactive isotopes of iodine (iodine-129) has a half-life of 16 million years; technetium-99 = 211,000 years; and plutonium-239 = 24,000 years. Xenon-135,
a noble gas, decays into cesium-135, an isotope with a 2.3-million-year half-life.
14. Every exposure to radiation increases the risk of damage to tissues, cells, DNA and other vital molecules, potentially causing programmed cell death(apoptosis), genetic mutations, cancers, leukemias, birth defects, and reproductive, immune, cardiovascular and endocrine system disorders.
This pamphlet is intended for reprint. You are encouraged to copy and distribute it widely
Land acquisition for Andhra Pradesh nuclear plant cleared
RELATEDS A. Srinivasa Rao Hyderabad, December 29, 2011 | UPDATED 15:10 IST
The first step to build the controversial 6,000-megawatt nuclear power plant at Kovvada village in Srikakulam district of Andhra Pradesh has been taken, with the state ordering the land acquisition process.
The Nuclear Power Corporation of India Limited (NPCIL) will go ahead with the Srikakulam project despite raging protests over the Kudankulam plant in Tamil Nadu.
The Andhra Pradesh government on Tuesday (G.O.No.270,dt.27-12-2011) issued an order to acquire a 1000-hectare of land from farmers in and around the Ranasthalam area. The land includes 775.5 hectare for the power plant and another 125 hectare for a township.
The township will house Central Industrial Security Force (CISF) personnel too, who will protect the sensitive site.
The government constituted a 11-member team and appointed 28 officials on contract for the land acquisition. The NPCIL will pay for the land and salaries to the acquisition staff, though the staterun AP Power Generation Corporation will be the nodal agency to oversee the entire project.
Official sources said the Centre has, in principle, approved the Kovvada project - the first set of four sites identified last year to set up nuclear plants as part of the civil nuclear agreement with the US.
American technical knowhow will be amply used in the Rs.1lakh crore Kovvada project. US expertise will help construct six light water nuclear reactors, each bearing a capacity of 1,000 mw.
The project has been in a limbo over the past six months in the wake of protests after the Fukushima disaster in Japan. The state finally approved the land acquisition process when Prime Minister Manmohan Singh said his government was firm on Kudankulam and other nuclear projects.
However, non-government organisations and environmentalists were determined to stop the project.
In March, 35 villages in the Ranasthalam area protested against the plant. The farmers and fishermen feared that radioactivity and groundwater pollution would reduce their produce and kill the fishes.
EAS Sarma, former Union energy secretary, said the nuclear reactors proposed at Kovvada were untested and, hence, could be unsafe. "India has embarked on a nuclear adventure by opening the floodgates to foreign reactors, without ensuring that matching arrangements exist for an independent regulatory oversight. The Centre has shown utter disregard to public opinion," he said.
Meanwhile, chief minister Kiran Reddy and other Congress leaders have been lobbying hard to convince people who would have to give up their land for the plant.
Read more at:
The concentration of radon gas is measured in units of
picocuries per litre (pCi/L) or becquerels per cubic metre (Bq/m3)
of ambient air. The concentration of radon daughters is measured in working
level (WL) units this is a measure of the concentration of potential alpha
particles per litre of air.
The worker's exposure to radon daughters is expressed
in units of Working Level Months (WLM). One WLM is equivalent to 1 WL exposure
for 170 hours.
1 WL = 130,000 MeV alpha energy per litre air
= 20.8 µJ (microjoules) alpha energy per cubic meter (m3) air
WLM = Working Level Month
= 1
WL exposure for 170 hours
Often people use the concentration of radon gas
(pCi/L) in the air to estimate the WL level of radon daughters. Such estimates
are subject to error because the ratio of radon to its decay products (radon
daughters) is not constant.
Equilibrium factor is ratio of the activity of all the
short-lived radon daughters to the activity of the parent radon gas.
Equilibrium factor is 1 when both are equal. Radon daughter activities are
usually less than the radon activity and hence the equilibrium factor is
usually less than 1.

mJ-h/m3 = millijoule
hours/per cubic metre
MBq-h/m3 = megabecquerel hours per cubic
meter
Joule is unit of energy
1 J = 1 Watt-second = Energy delivered in one second
by a 1 Watt power source
1 calorie = 4.2 J
MBq/m3 = megabecquerel per cubic metre
WLM = Working Level Months

Gamma Ray produces 100 Ergs per gram
of any material
Absorbed energy dose RAD = 100 Ergs
of energy/gm of any material due to ionization
1 Erg of Energy = 1 billionth of a
Btu = 1 tenth millionth of a Watt
http://www.nrc.gov/reading-rm/basic-ref/teachers/05.pdf
http://www.mpoweruk.com/conversion_table.htm
http://publications.gc.ca/collections/Collection/H49-96-1-1995E-2.pdf (Field exposure calculations)
http://www.mpoweruk.com/conversion_table.htm
http://publications.gc.ca/collections/Collection/H49-96-1-1995E-2.pdf (Field exposure calculations)
PREPAREDNESS OF THE
OPERATING ORGANISATION FOR HANDLING EMERGENCIES AT NUCLEAR POWER PLANTS (AERB)
The Emergency Response Manual
shall describe classifications of emergencies based on severity and magnitude
of the condition in theaffected zones [Ref. Fig. 1]. Each category shall be
associated with an intervention level for which appropriate countermeasures
shall be specified. In accordance with different degrees of severity of the
potential consequences, emergency situations12 are graded.
Emergency situations are
categorized as follows:
(i) emergency standby;
(ii) personnel emergency;
(iii) plant emergency;
(iv) site emergency; and
(v) off-site emergency.
3.1.2 The agencies responsible
for carrying out remedial measures during the different categories of
emergencies [Ref. Role of Regulatory Body Concerning Emergency Response at
Nuclear & Radiation Facilities (AERB/
SG/G-5)] mentioned above are as
follows:
Type of
Emergency
|
Responsible
Agency
|
Emergency
standby
|
Plant
management
|
Personnel
emergency
|
Plant
management
|
Plant
emergency
|
Plant management
|
Site emergency
|
Plant
management
|
Off-site
emergency
|
District
Authorities of the StateGovernment having jurisdiction over
the public
domain affected by theaccident, normally the DistrictCollector.
|
12 International Atomic Energy
Agency has evolved an international nuclear event scale (INES) for classifying
nuclear events according to their severity. [Ref. Figs. 2A,2B&2C].
Light water reactor core melt accidents
The core inventory (Table 3) lists a number of radionuclides
that represent the greatest hazard
in
a reactor accident and gives generic values for their activity at the end of
life of a core
Nuclides
|
Half life (days)
|
Radioactive inventory Exa Bq (1018 Bq)
|
Noble gases
|
||
Kr-85
|
3 950
|
0.024
|
Kr-85m
|
0.1883
|
1.2
|
Kr-87
|
0.0528
|
2.1
|
Kr -88
|
0.117
|
2.8
|
Xe-133
|
5.28
|
6.7
|
Xe-135
|
0.384
|
1.4
|
Iodine
|
||
I-131
|
8.05
|
3.2
|
I-132
|
0.0958
|
4.8
|
I-133
|
0.875
|
6.7
|
I-135
|
0.280
|
6.3
|
Caesium
|
||
Cs-134
|
750
|
0.48
|
Cs-137
|
11000
|
0.24
|
Others
|
||
Sr-90
|
10400
|
0.18
|
Ru-106
|
366
|
1.1
|
Te-132
|
3.25
|
4.8
|
Ba-140
|
12.8
|
6.3
|
Ce-144
|
2.84
|
3.4
|
Pu-238
|
32500
|
0.0044
|
Pu-239
|
8.9 106
|
0.0010
|
Cm-242
|
163
|
0.003
|
2.3.2.2
The Three Mile Island accident
The most important accident in history involving a PWR reactor
occurred on March 28, 1979 at Harrisburg, Pennsylvania, United States of
America. It was initiated by a stop of the secondary water feed pumps,
resulting from the absence of communication between the maintenance teams and
the operators. The reactor stopped automatically but the coolant loss induced a
quick raise of the primary temperature and pressure since there was no residual
heat evacuation from the core. A valve on top of the pressuriser opened
automatically to reduce the pressure. This valve remained open for several
hours because of a failure of the automatic locking. The operators because of
an erroneous indication did not observe this failure. A series of incorrect actions
(such as untimely stopping the emergency cooling) mainly resulting from the
absence of information on the situation of the core, were at the basis of a
fusion of the core and of a massive release of fission products to the
containment building. A dose rate of 60 Gy/h was measured in the building.
Defence of the leak tightness of the building was continued during several
days, the major risk being linked to the presence of hydrogen in the reactor
and in the containment building. A leak of contaminated liquids at the beginning
of the accident caused a relatively low release of rare gases (370 PBq of 133Xe (9% of the inventory) and 5 × 10⁻⁴ PBq of 131I).
The most important exposure route was by the direct exposure to
the passing radioactive cloud. The low speed and variable direction of the wind
created a very complex atmospheric dispersion at this place.
Evacuation of pregnant women and young children was imposed.
This decision gave rise to the
spontaneous evacuation of more than 100 000 persons.
The maximum dose received per individual was estimated at 0.4
mSv.
2.3.2.3
The Chernobyl accident
The most serious accident up to now in a nuclear power plant
occurred on April 26, 1986, in unit 4 of Chernobyl, situated at 100 km north
from Kiev, capital of Ukraine. The reactor type is RBMK (cooling: boiling
water, moderator: graphite). The reactor was destroyed as a consequence of an
explosive reactivity runaway during a transient following a test. This test had
to demonstrate the feasibility of generating a sufficient quantity of emergency
electric power with the inertia of the turbine of the power plant in case of a
shutdown resulting from a defective external supply of electricity. The
accident scenario showed a hardly believable accumulation of operation
deviations: putting out of service the automatic protection systems, operations
without technical specifications, as well on a neutron level (reactivity
control) as on a thermo-hydraulic level. Moreover, the reactor concept did not allow
human errors (as for instance a positive void coefficient, meaning that
substitution of water by steam in the core increases the reactivity, a positive
reactivity contribution resulting from the insertion of the safety rods by the
presence of Be at the head of the rods). The explosion destroyed the weak
containment of the reactor and set fire to the adjacent structures. The firemen
were exposed to unknown yet very high dose rates. After extinction of the fire
(a few hours), the reactor was bombarded with various materials with a view to
creating a barrier against the releases and guaranteeing the subcritical state
of the reactor. Emissions only stopped after 10 days of continued efforts and
having injected liquid nitrogen underneath
the reactor. Table 5 gives the most important emissions due to the
accident. The released fractions correspond with the theoretical predictions of
the source term in case of an early failure of the containment of a PWR
reactor.
Nuclides
|
Released fraction (% of
the core inventory)
|
Released activity
(PBq)
|
Xe-133
|
100
|
6 500
|
I-131
|
55
|
1 800
|
Cs-137
|
33
|
85
|
Cs-134
|
33
|
52
|
Sr-90
|
4
|
8
|
Pu-239
|
3.5
|
3 10-2
|
Table
5 : Most important emissions due to the Chernobyl accident
Table 7 [3] shows the estimated collective doses. Figure
5 shows the impact of evacuation on the
evacuees of Belarus. The collective dose is estimated at about 25 % of the dose
that might have been received without evacuation.
Country
|
Number of persons evacuated
|
Collective dose (man⋅Sv)
|
||
Thyroid*
|
External
effective dose
|
Internal effective dose
|
||
Belarus
|
24 725
|
25 000
|
770
|
150
|
Russian Federation
|
186
|
<1 000="000" span="span">
|
<10 span="span">
|
<10 span="span">
|
Ukraine
|
91 406
|
30 000
|
1 500
|
1 300
|
Total
|
116 317
|
55 000
|
2 300
|
1 500
|
*
Units: man⋅Gy
Summary of
estimated collective effective and thyroid doses to populations of areas
evacuated
in
1986 [3].

CONVERSION UNITS BECQUEREL TOSIEVERTS
Conversion of
Becquerel to millisievert
The
contamination of soil, food and water is given in Becquerel/sq.metre or
Becquerel/Kg or litre. [58]
Becquerel (Bq)
means one disintegration per second.
The Becquerel (Bq) measures the activity of radioactive substances, whereas the Sievert (Sv) evaluates the effects of radiation on the body.
A measure of
the biological damage to living tissue as a result of radiation exposure.
Also known as the " biological dose," the dose equivalent is
calculated as the product of absorbed dose in tissue multiplied by a quality
factor and then sometimes multiplied by other necessary modifying factors at
the location of interest.
The dose
equivalent, measured in sievert, defined as the dose of absorbed radiation
that has the same biological effect as a dose of one joule of gamma rays
absorbed in one kilogram of tissue. In the United States the roentgen
equivalent man (rem), equal to 0.01 sievert, is still in common use, although
regulatory and advisory bodies are encouraging transition to sieverts
1 Bq
= 0,0125 microsievert
1 microsievert = 80 Becquerel = 1mSv = 80,000 to 1,00,000Bq/sq.m
Eating an
amount of food with 80.000 Becquerel Caesium 137 is equivalent to
approximately one millisievert.
Eating 200 g mushrooms contaminated with 4.000 Becquerel Caesium 137/Kg s equivalent to 0,01 Millisievert.
The radiation
exposure considers how long the exposure took place. It is given in
Millisievert/year. Example; The natural radiation exposure in Germany is 2,1
Millisievert/year (0,24 Microsievert/hour) another 2Millisievert are added as
artificial radiation (mainly medical devices)
Food radiation
should not exceed 500 Becquerel/Kg
Baby food radiation should not exceed 400 Becquerel/Kg for Caesium and 100 Becquerel for iodine |
1.
At 19:03 ON 11-3-2011 evacuation of Fukushima was
ordered with 1864 people within 2km
from the plant.
2.
Evacuation extended to 3km with 5800 people at
21;23 on 11-3-2011 by PM office with population within 10km to stay indorrs.
3.
Evacuation expanded at 5:44 AM on 12-3-2011 upto
10km and later on to 20km at 18:25 on the same day plus seawater was ordered
for emergency cooling
4.
50,000 people evacuated on 12-3-2011 and it was
increased to 2 lakhs on 13-3-2011 when melt down was anticipated.
5.
Evacuation extended by Natoto Kan, PM upto 20km
and 20km and 30km people were asked to
stay indors.
6.
USA advised on 16-3-2011 the Americans and Japan
to move out to 50miles (80km) from the plant on the plea that Japan was not
telling the full truth.
7.
Spain advised their people to live an area of
120km, Germany advised their people to move out of Tokyo, South Korea advised their
people to evacuate more than 80km’
8.
Japan advised people between 30km to leave their
houses
9.
On 30-3-2011 IAEA found 20MBq/m2 I-131 in the samples from 18th to
26th March in Litate village and 40km from the plant based on
criteria of 10MBq/m2
10.
IAEA announced on 31-3-2011 new value of 7MBq/m2from
samples between 19 to 29 March in Litate
11.
The material deays at 8% to 9% each day
12.
6 months after Fukushima accident French experts
found 7 lakh Bq of cesium per sq.m on grass in a school in Fukushima city over
60km from Daiichi Fukushima plant
13. The
compensation payments to victims of nuclear accident already exceeded
150billion Yen and it will go upto 4.54 trillion Yen or equivalent to 59
billion US dollars or Rs.3 lakh corrodes by march 2013 as per the report by a
commission of the Japanese Government.