Cloud seeding operations for drought mitigation- an experience of
Andhra Pradesh
PROF.T.SHIVAJI RAO,
DIRECTOR, CENTER FOR ENVIRONMENTAL STUDIES,
GITAM UNIVERSITY, VISAKHAPATNAM-45
http://jcsepa.mri-jma.go.jp/outreach/20070131/Presentations/P3_Yao.pdf [chinese work,good]
36’ to 19008’
and longitudes 76038’ to 80055’ covering
an area of 1,35,680 km2 in the 12 districts during 2003-2009. Mostly
the cloud seeding has occurred between the altitudes of 1200-2500 m above mean
sea level with an updraft velocity of 0.5-3 m/s. This conforms that these
clouds are warm clouds well below the freezing level (5800 m) in the seeding
area. Most of the clouds are seeded at the base by releasing hygroscopic
material (mostly Calcium Chloride) with the help of pressurized aircrafts
fitted with hygroscopic flares. C-Band analogue weather RADARs with TITAN
(Thunder Strom Identification Tracking and Now casting) software were used to identify
the clouds and to analyze the cloud growth. On an average not more than 23% of
the seedable clouds are seeded with the existing infrastructure. It is observed from the RADAR data that there
is an increase in Cloud Volume, Area, Reflectivity, Life and Lowering of
Centroid after seeding indicating that the Clouds are responding to seeding
material. It is also observed in general that,
cloud seeding is more effective if we get active monsoon clouds and it
is less effective if we get weak monsoon clouds. Overall about 17% of total
rainfall could be attributed to cloud seeding during the years 2005-2009.
http://jcsepa.mri-jma.go.jp/outreach/20070131/Presentations/P3_Yao.pdf [chinese work,good]
Note: This article prepared by the JNTU Cloud seeding center staff was obtained by Prof.T.Shivaji Rao to show how cloud seeding is bound to succeed in the hands of genuine experts who plan the programme on scientific lines and get it executed with dedicated workers. Since Prof.Rao happen to be one of the advisors for this programme for 6 years that is 2004 - 2009.He had a unique opportunity in supervising the planning, execution and assessing the results. For understanding the scientific basis for warm cloud seeding and cold cloud seeding please browse through the following articles on the websites below.
https://docs.google.com/viewer?a=v&pid=sites&srcid=ZGVmYXVsdGRvbWFpbnxzaGl2YWppcmFvMzJ8Z3g6NjFlZjg1NWI0ZTVhZTM2Mg&pli=1
(CLOUD SEEDING BOOK OF 176 PAGES WITH COLOUR FIGURES AND DETAILED EXPLANATIONS ON METHODS OF CLOUD SEEDING FOLLOWED IN INDIA AND FOREIGN COUNTRIES WHO ARE USING CLOUD SEEDING TO AUGMENT RAINFALL FOR DRINKING, IRRIGATION AND POWER GENERATION AT A VERY INEXPENSIVE COST BY USING GROUND GENERATORS OR AEROPLANES AS PRACTICED IN CHINA ALSO)
(CLOUD SEEDING BOOK OF 176 PAGES WITH COLOUR FIGURES AND DETAILED EXPLANATIONS ON METHODS OF CLOUD SEEDING FOLLOWED IN INDIA AND FOREIGN COUNTRIES WHO ARE USING CLOUD SEEDING TO AUGMENT RAINFALL FOR DRINKING, IRRIGATION AND POWER GENERATION AT A VERY INEXPENSIVE COST BY USING GROUND GENERATORS OR AEROPLANES AS PRACTICED IN CHINA ALSO)
Abstract
Cloud Seeding
for Precipitation Enhancement has been carried out by Government of Andhra
Pradesh, India in the Rain Shadow (<600 12="" andhra="" between="" latitudes="" mm="" of="" pradesh="" region="" sup="">0
1. Introduction
Thirteenth
world meteorological congress in May 1999 noted that the weather modification
for rainfall enhancement is one of the tools in the total gamut of water
resources management (WMO, 1999). In
the Indian context it is well established fact that even if we achieve ultimate
irrigation potential, we can irrigate only 30% of cultivable land, remaining
70% is under rain fed conditions where erratic and low rainfall is the problem (IWRS,
1999). Research shows that even the
watershed management activities in the rain fed agriculture may not yield good
results if the rainfall deficiency is more than 20% (ICHWAM, 2002). In India the Meteorological drought is
declared if the rainfall deficiency is 25% and above (Subramanya, 2005). If the cloud seeding programme could
cover the above deficiency of rainfall it is worth taking up. This was the
background under which cloud seeding operations in Andhra Pradesh were started
in the year 2003 and has been continued till 2009.
2. What is cloud seeding for rainfall
enhancement?
Cloud seeding for rainfall enhancement is a process of
introducing Cloud Condensation Nuclei (CCN) of appropriate size of hygroscopic
(for warm cloud) or glacio-genic (for cold cloud) nature in to the cloud to
enhance the cloud’s ability to precipitate. Usually to produce a rain drop, a
cloud condensation nuclei is required surrounding which water vapor condenses
and forms as rain drop that falls on the earth under the gravity. The CCN is
naturally produced by aerosols emanated from various mechanisms including
evaporation from the oceans (Sodium Chloride) and continents, apart from wind
blown dust and various gaseous emissions from industries, transport and burning
of forests etc. Not all these aerosols contain required size and number of CCN
to produce natural rain. Whenever such depletion of CCN is observed in the
natural clouds we introduce required CCN in to the clouds artificially to
enhance the rainfall known as cloud seeding for rainfall enhancement.
3. Some earlier Cloud Seeding Experiments
in India
In India
as early as 1951, TATA firm has used Silver Iodide through ground generators to
seed the clouds over the Western Ghats (CAIPEEX
Implementation Plan, 2009). The rain
and cloud physics research unit under the aegis of Council of Scientific and
Industrial Research has conducted long term cloud seeding programme over North India, using ground based salt generators during
the period 1957-1966. The results showed an increase in rainfall by 20% (Ramana
Murty et al, 1968). Indian Institute
of Tropical Meteorology has conducted several cloud seeding experiments during
1973-74, 1976 and 1979-86. The results showed 24% increase in the rainfall (Murty
et al, 2000). During the decade 1980-1990, the world has witnessed many
advances in the airborne instrumentation, radars, flares and software’s. They
got imported to India
in new millennium. In the year 2003 the Government of Karnataka has initiated
cloud seeding with modern gadgets like radars and aircrafts Government of Maharashtra
followed a month later.
4. Cloud seeding operations of
Andhra Pradesh.
The Government of Andhra Pradesh
has declared nearly 555 Mandals (revenue and administrative divisions with in
the district) as Rain Shadow Area mainly in the districts of Ranga Reddy,
Nalgonda, Medak, Karimnagar, Mahaboobnagar, Guntur,
Prakasam, Nellore, Kurnool, Anantapur, Kadapa and Chittoor. In
these Mandals the average annual rainfall is less than 600 mm and below. Hence
they were declared as Rain Shadow Area in the year 2005. The Cloud Seeding is
aimed to enhance the rainfall as well as to narrow down the dry spells during
the monsoon season. In Andhra Pradesh Cloud Seeding was started in the year
2003 and has been continued year after year till 2009 - perhaps one of the
biggest and longest operational cloud seeding program in Southeast
Asia with an average cost of around rupees 25crores per year. In
2003 the Cloud Seeding was monitored by Water And Land Management Training and Research
Institute (WALAMTARI) while it was Panchayati Raj Department, Government of
Andhra Pradesh in the year 2004. Later from the year 2005 onwards the
Government of Andhra Pradesh has created Rain Shadow Areas Development (RSAD)
Department and entrusted the monitoring of the Cloud Seeding to Jawaharlal
Nehru Technological University Hyderabad (JNTUH) in view of the program’s
Scientific and Technological nature. The JNTUH in turn has established a
separate department namely Centre for Earth, Atmosphere and Weather
Modification Technologies (CEA&WMT) and has been monitoring the Cloud
Seeding Programme with experienced and expert Meteorologists since the year
2005.
5. Cloud seeding operations in
the 2009 drought year
Never before
the state has witnessed both severe drought and floods as in the year 2009. The
A.P Cloud Seeding Programme for the first time has faced the severe drought
situation and tried to mitigate it as much as possible. The result is that the
cloud seeding has helped in mitigating the drought to some extent but could not
avert it since the number of seedable clouds available in the severe drought
situation is far less when compared to normal situation. An analysis of the
rainfall data of seeded mandals provided by the Bureau of Economics and
Statistics, Government of Andhra Pradesh has thrown an interesting fact that it
is only 41.38 % of excess rainfall mandals in the state lies in the Rain Shadow
Area at the beginning of the Cloud Seeding Programme, while the same figure has
increased to nearly 95.65% by the end of the Cloud Seeding Programme in the
year 2009 (Table.1). This figure has been achieved even before the floods in
the Krishna Basin. The seeding locations during the monsoon
period for the year 2009 and the corresponding rainfall for the same period is
shown in Fig.1. From the figure it can be observed that most of the excess
rainfall areas are located in the intense cloud seeding zones of Andhra
pradesh.

6. Preliminary Results of the CAIPEEX Experiment by Government of India
The government of India
has taken up a national experiment namely “Cloud Aerosol Interaction and
Precipitation Enhancement Experiment (CAIPEEX)” through Indian Institute of
Tropical Meteorology (IITM). The main aim of this experiment is to understand
microphysical properties of the clouds in the interaction between aerosol and
the cloud apart from conducting cloud seeding experiments to enhance the
rainfall in various parts of the country. This experiment was started in the
year 2009 and will be continued till the year 2012. As part of the first phase,
they have measured the microphysical properties of the clouds from May to
September in the year 2009 at various parts of the country by flying with
specially instrumented Cloud Physics aircraft for the purpose (CAIPEEX Implementation Plan, 2009). The preliminary results of these
measurements are indicating that the clouds over Telangana and Rayalaseema
regions are seedable to enhance the rainfall and observed that the natural
Cloud Condensation Nuclei (CCN) over these regions is of the order of 0.5
microns (CAIPEEX Preliminary results Phase-I, 2009). In the cloud seeding
programme it is the general practice that we introduce giant nuclei
artificially which is having the size more than the natural CCN size to enhance
the rainfall.
Meanwhile the CEA&WMT of
JNTUH has tested the flares used in the Cloud Seeding programme of A.P by
utilizing the above Cloud Physics Aircraft. In these tests it came to know that
the flares being used are capable of producing the CCN size of the order of one
micron and above which is more than the natural CCN size as mentioned above (Table.2).
Infact these flares were tested on the ground, the actual particle size near
the cloud base during the operations will be more as per the cloud seeding Experts.
According to existing literature the artificial CCN size has to be further
increased to about 2 to 3 microns to get the better results. Infact the CAIPEEX
programme will examine the resulting rainfalls with varying CCN materials and
sizes during the years 2010 and 2011. We have to wait for the results at least
for one more year. In view of these findings it can be said that the A.P. Cloud
Seeding programme has been progressing well with the latest scientific and
technological advancements.

Similarly such experiments can be
attempted in other parts of the country particularly low rainfall regions of
western, northern and central India
where natural CCN depletion is observed.
7. Infrastructure & equipment for cloud
seeding Operations.
The cloud
seeding operations over Andhra Pradesh were conducted with the aid of two
C-Band Weather RADARs located at Hyderabad and
Anantapur (Fig.2) and two Cessna Pressurized Aircrafts operated from Hyderabad and Bangalore.
Most of the seeding was done with the Hygroscopic material (Calcium Chloride)
which is burnt below the cloud base where the
Table.2. size of the CCN in the Natural
clouds and Hygroscopic Flares.
HYDERABAD REGION
|
ANANTHAPUR REGION
|
FLARE
|
|||
Particles Size (Microns)
|
% of Total
|
Particles Size (Microns)
|
% of Total
|
Particles Size (Microns)
|
% of Total
|
0.2
|
41.60%
|
0.1
|
41.60%
|
0.8
|
28.50%
|
0.4
|
33.30%
|
0.3
|
33.30%
|
1
|
12.50%
|
0.6
|
16.60%
|
0.5
|
16.60%
|
0.2
|
14.60%
|
0.8
|
8.30%
|
0.7
|
8.30%
|
0.4
|
10.20%
|
updrafts are
maximum. Generally the seeding activity
was covered in the districts of Southern Telangana and Rayalaseema region with
latitudes of 12036’ to 19008’ and longitudes of 76038’
to 80055’. The raw data of RADAR has been processed with the help of
TITAN (Thunderstorm Identification, Tracking, Analysis and Now casting)
software (Dixon et al, 1993) and used to vector the aircrafts towards the
seedable clouds. Usually the seedable clouds are having the reflectivity of at
least 20 dBZ and appeared mostly in the monsoon season between the months of June
to November covering both South West and North East monsoon.

The success
of the cloud seeding experiment is evaluated by analyzing the TITAN processed
RADAR data with Target and Control Method, Double Ratio Method and Chemical
Analysis of Rainwater samples. Moreover the altitudes of the seeding
operations, associated updrafts at the cloud base and the availability of
clouds in a given season were also analyzed.
8. Target and Control Method
In this
method the target means the seeded cloud, while the control means the unseeded
cloud, which are selected in such a ways that they are 50-60 km apart in cross
wind direction, appearing at same time within in the 90 km radius of the RADAR
vicinity and they should possess the similar magnitude of microphysical
properties up to the time of seeding. The results are analyzed by plotting the
temporal variation in the parameters such as Volume, Area, Mass, Vertical
Integrated Liquid Content, Precipitation Flux, Height of Maximum Reflection,
Cloud Base Height, Cloud Top Height. However only four parameters are discussed
as shown (Fig.3) for a case study on August 11, 2008, 11:20GMT.
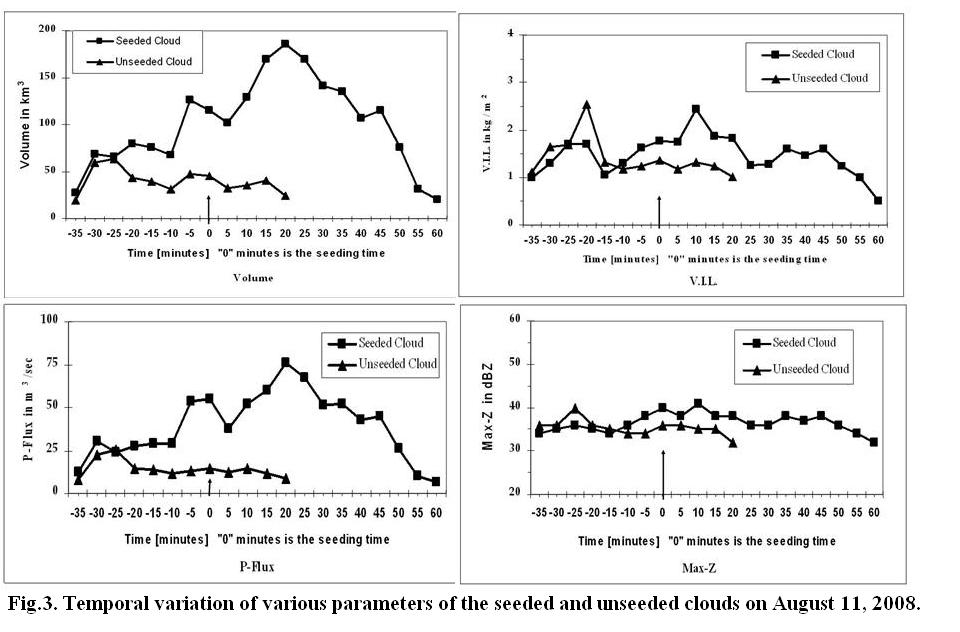
From the Fig.3
it can be observed that, all the four parameters of the seeded cloud have shown
increase in magnitude, though they are in decreasing stage at the time of
seeding, while the same is not happened for the unseeded cloud. The increase of
dBZ value after seeding, followed by increase in Vertical Integrated Liquid
content indicates that there is a formation of liquid water droplets. This in
turn is well supported by increase in Precipitation flux, indicating that there
is an increase of mass at the base of the cloud. Similarly the growth of the
Volume of the cloud after seeding may confirm that there is a release of heat
energy due to the formation of water droplets in the cloud. Moreover the seeded
cloud has lasted for longer duration, compared to the unseeded cloud.
In order to
remove the bias in selection of the individual clouds for comparison purpose, 20
seeded and 20 unseeded clouds are selected from the same region, in such a way
that they have the life time of 50 to 60 minutes and seeding was occurred with in
the first 30 minutes of the cloud genesis. The graphs (Fig.4) are drawn for the
temporal variation of the total rain mass of the seeded and unseeded clouds.
From the graphs it can be observed that, initially both seeded and unseeded
clouds have shown intense growth during first 15-20 minutes, however the seeded
clouds have shown higher magnitude of rain mass and lasted longer than the
unseeded clouds.

9. Double Ratio Method
It is the
ratio of two ratios and is given as follows (Ali Umran, 2008).
 ---- (1)
Where IC = Impact Coefficient, S = Total
rainfall in the target area during seeding period, NS = Total rainfall in the
control area during seeding period, H = Total rainfall in the target area
during 10 unseeded years, K= Total rainfall in the control area during 10 unseeded
years.
If I.C >1, then it indicates the influence
of seeding. In the present paper, target area and control area are selected in
such a way that, they are from the same climatic zone and the correlation
coefficient between rainfalls of target and control areas for the 10 unseeded
years is maximum. The results are as shown in Table.3. From the Table.3 it can be observed that,
Nalgonda district is taken as target and the neighboring districts are taken as
controls. Nalgonda and Mahaboobnagar are highly correlated in their natural
rainfall occurrence with a correlation coefficient of 0.78. The Impact
Coefficient of 1.57 between these districts indicates that there is a 57%
change in the rainfall in the target district during the seeding days,
indicating the influence of seeding by way of rainfall enhancement up to 57% in
the target district.
Table.3
Calculation of Impact Coefficients using Double Ratio Method for Nalgonda
(Target) and neighboring districts (Control).
Correlations
coefficients for Nalgonda district vs.
Control districts
|
||||
↓Target
/Control districts→
|
Mahaboobnagar
|
Ranga
Reddy
|
Medak
|
|
Nalgonda
|
0.78
|
0.6
|
0.45
|
|
Impact
Coefficients for the year2008 for 17 Days of Cloud Seeding operations
|
||||
A = S/NS
|
b =
H/K
|
I.C= a/ b
|
Change %
|
|
Nalgonda
vs. Mahaboobnagar
|
1.68
|
1.07
|
1.57
|
57
|
Nalgonda
vs. Ranga Reddy
|
1.61
|
0.85
|
1.89
|
89
|
Nalgonda
vs. Medak
|
1.52
|
0.83
|
1.83
|
83
|
Impact
Coefficients for the year 2007 for 21 Days of Cloud Seeding operations
|
||||
a = H/K
|
b= S/NS
|
I.C= b/a
|
Change %
|
|
Nalgonda
vs. Mahaboobnagar
|
1.41
|
1.07
|
1.32
|
32
|
Nalgonda
vs. Ranga Reddy
|
1.18
|
0.85
|
1.39
|
39
|
Nalgonda
vs. Medak
|
1.84
|
0.83
|
2.22
|
122
|
10. Longterm
Rainfall analysis in Nalgonda district
The monsoon rainfall data of the Nalgonda district
has been collected for the period of 1990-2009 for both seeded and unseeded
areas in the district to verify whether the seeded areas have improved their
rainfall or not when compared to the unseeded areas in the district. A graph
has been drawn (Fig.5) to depict the yearly variation of rainfall and its 3
years moving average. It can be observed from this graph that the 3 years
moving average curve has shown improving trend of rainfall in seeded area when
compared to the unseeded areas during the period of cloud seeding. This is an indication of
success of cloud seeding in terms of long term rainfall improvement.

11. Chemical Analysis of Rain Water Samples
Rain water samples for the years 2007 and
2008, from Nalgonda and Chittoor districts were collected during seeded and
unseeded days and analyzed for the concentrations of Calcium and Chloride - the
prime cation and anion present in the Hygroscopic material used for seeding.
The results are as shown in Fig.6. It can be observed from the Fig.6

that, in the majority of the cases the
magnitude of the calcium and chloride is more in rainwater samples collected
from the seeded clouds than that of the unseeded clouds, confirming the fact
that the Hygroscopic material is released at the base of the clouds is acting
as Cloud Condensation Nuclei.
From the above three analyses it can be
reasonably inferred that, the clouds in this region are responding to the
seeding. And the magnitude of the growth is quite substantial. In order to
further probe in to the seeding details the updrafts and seeding altitudes are also
analyzed.
12. Seeding
Altitudes and Updrafts
The altitudes and updrafts at which the
seeding occurred over the years (2005-2008) were recorded from the flight logs
and are shown in Fig.7 and 8. From the
Fig.7 it can be observed that most of the seedings were performed at an
altitude range of 1 to 2 km, indicating that warm cloud seeding is predominant.
Moreover during the initial years like 2005 and 2006, cold cloud seeding too
(above 4 to 5 km) was also experimented, but from the operational point of view
it was observed that it is better to seed warm clouds in view of their large
number of availability over the region.
From the Fig.8 it can be observed that the
updrafts observed at the base of the cloud during the time of seeding is
varying between 1 m/sec to 5 m/sec in most of the times, but occasionally it is
reaching up to a maximum of 10 m/sec. Since most of the clouds were seeded
within the first 30 minutes after their genesis, the updrafts indicated above
gives suitable updraft range for effective seeding in this region and
prevalence of convective activity in the cloud during this time.


13. Influence of Active and Weak monsoon over cloud
seeding operations
During 2009 cloud seeding operations there
was a continuous weak spell followed by active spell in the South West monsoon.
The responses of the clouds due to seeding in these spells were observed by
analyzing various microphysical properties of the seeded clouds. Based on the growth observed in the
properties of the cloud after seeding, the responsiveness of the clouds was
determined and is depicted in the Fig.9.
From the Fig.9 it can be observed that, the
more the active the monsoon, the more is the number of clouds available for
seeding and the more is the responsiveness of clouds for seeding. It means that
rainfall enhancement is more during the active monsoon due to increased
moisture feeding.

14.
Success rate and number of clouds seeded
For the year 2009 an analysis has been
carried out to calculate number of clouds seeded and their success rate as identified
from the RADAR data of Hyderabad
and Anantapur stations and is shown in Table.4.

From this table it can be observed that the
overall success rate of the cloud seeding programme is of the order of 76%. It
means that nearly 25% of the clouds are not responding to the seeding
operations and the reasons for the same could be attributed to variations in
the microphysical properties of the clouds at the time of seeding in the same
synoptic situation. Therefore in-depth observations of microphysical properties
of the clouds before and after seeding are necessary to enhance the success
rate for a given seeding material. Similarly there is a necessity of observing
the microphysical properties of the clouds for different seeding materials by
varying the particle size and chemical composition. More over it can also be
observed from the Table.4 that we could able to seed hardly 23% of the
available seedable clouds on a seeding day leaving nearly 77% clouds unseeded.
This indicates that there is huge scope of development of infrastructures such as
RADARs and aircrafts for cloud seeding operations in this region.
15. Computation of Rainfall Enhancement through
actual ground truth observations
Ground truth
is often difficult to establish as the existing Rain Gauge network is
insufficient. For such an experiment more Radio Reporting Rain Gauges are
required to compliment the operations. However with existing Rain Gauge Network
(i.e. one rain gauge per mandal covering an average area of 268.62 km2),
the rainfall analysis is carried out. In each Rain Gauge, previous 24 hours
rainfall is recorded and reported daily at 03:00 GMT. The total rainfall occurred
on a particular day in a Rain Gauge is taken as the rainfall resulting out of
seeding, if that Rain Gauge falls under zone of influence of the seeding. The
zone of influence is taken as the area covered by the circle with a radius of 50
km from the point of seeding. Though exact calculation of enhancement of
rainfall due to seeding is not possible with the present day rainfall
measurements, but it has been estimated that on an average about 17% of rainfall
may be attributed due to cloud seeding operations over Rain Shadow Region of
Andhra Pradesh during the period 2005 to 2009 (Table.5). Out of the five years 2007 is a active
monsoon year and 2009 is a weak monsoon year. From the Table.5, it can be found
that the more the vigorous the monsoon the higher is the rainfall enhancement
due to cloud seeding.
Table.5
Summary of rainfall enhancement estimation over Andhra Pradesh during
2005-2009.
Year
1
|
No. of Mandals
Seeded
2
|
Cumulative rainfall during seeding period
(mm)
3
|
Cumulative rainfall under zone of influence due to
seeding
(mm)
4
|
Average Rainfall per Mandal due to seeding
(mm)
5
(5=4/2)
|
Average Rainfall per Mandal during seeding period
(mm)
6
(6=3/2)
|
Rainfall attributed to cloud seeding operations in%
7
(7=5/6*100)
|
2005
|
492
|
292770.9
|
37633.8
|
76.49
|
595.06
|
12.85
|
2006
|
377
|
68356.0
|
11788.3
|
31.26
|
181.31
|
17.24
|
2007
|
575
|
322921.1
|
61910.4
|
107.6
|
561.60
|
19.15
|
2008
|
505
|
232022.3
|
42357.5
|
83.87
|
459.45
|
18.25
|
2009
|
481
|
230556.7
|
39239
|
81.57
|
479.32
|
17.01
|
16. Other
applications of weather modification
The Cloud
Seeding Operations in Andhra Pradesh though mainly applied for enhancing the
rainfall by controlled seeding, the other weather modification techniques
includes suppression of hail storms during pre monsoon season, dissipation of
Clouds during flooding season by over seeding and dissipation of fog during
winter season by controlled seeding techniques. These applications are already
being in use in many other countries. The biggest example is that during
Olympics in China,
they have stopped the rain during opening and closing ceremonies.
17.
Conclusions
Cloud Seeding operations for rainfall
enhancement over Rain Shadow Region of Andhra Pradesh have clearly demonstrated
that the clouds are responding substantially to the Hygroscopic seeding as has
been observed from the RADAR data with respect to growth in cloud Area, Volume,
Mass, Vertical Integrated Liquid Content and Precipitation Flux after the
seeding. The same is confirmed from the presence of Calcium and Chloride- the
basic Hygroscopic material used for seeding in the rain water samples.
Similarly the ground truth rainfall analysis has also shown that on an average,
17% of rainfall could be attributed to cloud seeding in the Rain Shadow Region.
It has been found that most of the seedable clouds in the area are warm clouds
occurring at an average altitude of 1 to 2 km with an average updraft of 2 to 5
m/sec. it was also observed that the more the vigorous the monsoon the more is
the success of the cloud seeding operations in enhancement of the rainfall.
Hardly 23% of the clouds are seeded with the available infrastructure leaving a
huge scope for infrastructural improvement in terms of deployment of additional
RADARs and Aircrafts.
References
1. Ali Umran
Komuscu, 2008. “An Assessment of Impact
of Cloud Seeding on Local
Rainfall
- A Case Study of First Part of the ISKI Rain Enhancement Program Conducted in
Istanbul, Turkey
During 1990-1991”, Journal of Weather Modification, Volume 40, pp.17-
27.
2. Cloud
Aerosol Interaction and Precipitation Enhancement Experiment, 2009.
“Implementation Plan”, IITM. 46p.
3. Cloud
Aerosol Interaction and Precipitation Enhancement Experiment, 2009.
“Preliminary Results Phase-I”, IITM. 46p.
4. Dixon, M. and Wiener,G.,
1993. “TITAN:
Thunderstorm identification, tracking, analysis
and nowcasting - a radar-based
methodology”, J.
Atmos. Ocean.
Tech, 10 (6), pp.785-797.
5. IWRS, 1999. “Theme
Paper on Water: Vision 2050”,. 74p.
6. Subramanya, K.,
2005. Engineering Hydrology (2nd
Edition), Tata Mc Graw-Hil. 392p.
7. Murty A.S.R.
et al.,2000. “11-year
warm cloud seeding experiments in Maharashtra”,
J.Wea Modification, 32, pp.10-20.
8. Proceedings
of International Conference on Hydrology and Watershed Management,
2002.B.S.Publications,Volume.1, 759p.
9. Ramana Murty
Bh.V., Biswas K.R., 1968.” Weather modification in India”, J.
Meteorological Society of Japan, 46, 160-165.
10.WMO, 1999. “Programme
on physics and chemistry of clouds and weather modification
Research”, Report no. 35,pp.1-68.